Markets
The Year Is Going Out with Stock Markets on a Tear
New highs in the stock markets are being seen. There has never been a bubble that didn’t eventually burst. Bond yields are falling, and the Fed is becoming a little more dovish as inflation is wrestled down. Economies are slowing but, so far, a recession has been held back. But for how much longer? Languishing has been gold and precious metals but there are positive signs that they are perking up.
It is easy to look back on our forecast for stock markets in 2023 and quickly discover that we were off a bit. We quote from last year’s conclusions:
“If you thought 2022 was bad, get ready for 2023. Bear markets such as we are witnessing are not just a one-year affair. They tend to be historic bears. While the average bear market is only just over a year, it is skewed with ultra-short bears such as the 40-day pandemic bear of March 2020. Since 1900 there have been 38 bear markets with DJI losses over 15%. Of that total, 11 or 29% have lasted just about two years or longer. The longest was the 1939–1942 bear lasting over 2.6 years. Currently, we are only about one year into this bear and it shows no signs of being over. Surprisingly, the Great Recession bear was only 1.4 years and the Great Depression bear lasted 2.4 years. But what they lost in length they made up in depth as the DJI fell 89% during the Great Depression and 54% during the Great Recession.” https://enrichedinvesting.com/wp-content/uploads/2022/12/Difficult-year-escalation-possible-Ukraine-war-persistent-inflation-recession-threat-commodity-hope.pdf
Instead of 2023 being a year from hell, it turned out pretty good. That is, if you owned the Magnificent Seven (Meta, Apple, Amazon, Alphabet (Google), Microsoft, Nvidia, and Tesla). Oh yes, and if you owned Bitcoin. Otherwise, it has been a struggle for many.
Over on the TSX you’ve done well if you were heavily into the Information Technology TKK sector, but otherwise your returns were mediocre to negative in other sectors. Interest-sensitive sectors like Income Trusts TCM, Utilities TUT, and Telecommunications TTS could all finish in the red in 2023. Golds TGD and Energy TEN could be headed there as well and Financials TFS, the largest TSX sector, is barely up on the year. The small cap TSX Venture Exchange (CDNX) appears destined to finish 2023 in the red. Many junior mining stocks were buried in the red down 50% or more on the year.
In the U.S. it’s not much better. The major indices are all up, but when one looks at the S&P sub-indices (major ones) we note that while technology did exceptionally well, four of the 11 S&P 500 sub-indices appear destined to finish in the red, including Health Care, Consumer Staples, Energy, and Utilities. Bank stocks, as measured by the KBW Bank Index and the KBW Regional Bank Index, were both in the red. The lesson seemed to be that if you picked the right sector, you did well; otherwise, the year might not have gone so well.
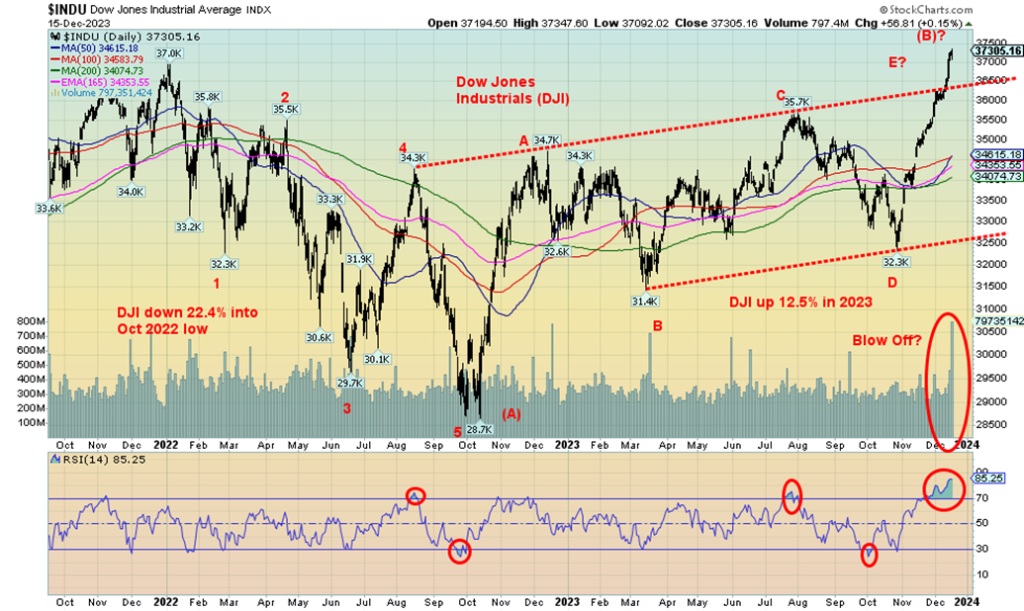
2022 was a poor year. It has been followed by a good up year in 2023. Despite it all, the highs of late 2021 and early 2022 remain intact, regardless of some indices and stocks making fresh 52-week highs, plus the Dow Jones Industrials (DJI) soaring to new all-time highs. Yes, the DJI hit new all-time highs, but it has been a lonely (mostly) walk so far. The Dow Jones Transportations (DJT) is nowhere near its all-time highs, a significant Dow Theory divergence. What will 2024 bring? A continuation of the rally that got underway in October 2022? Or the return of the bear market?
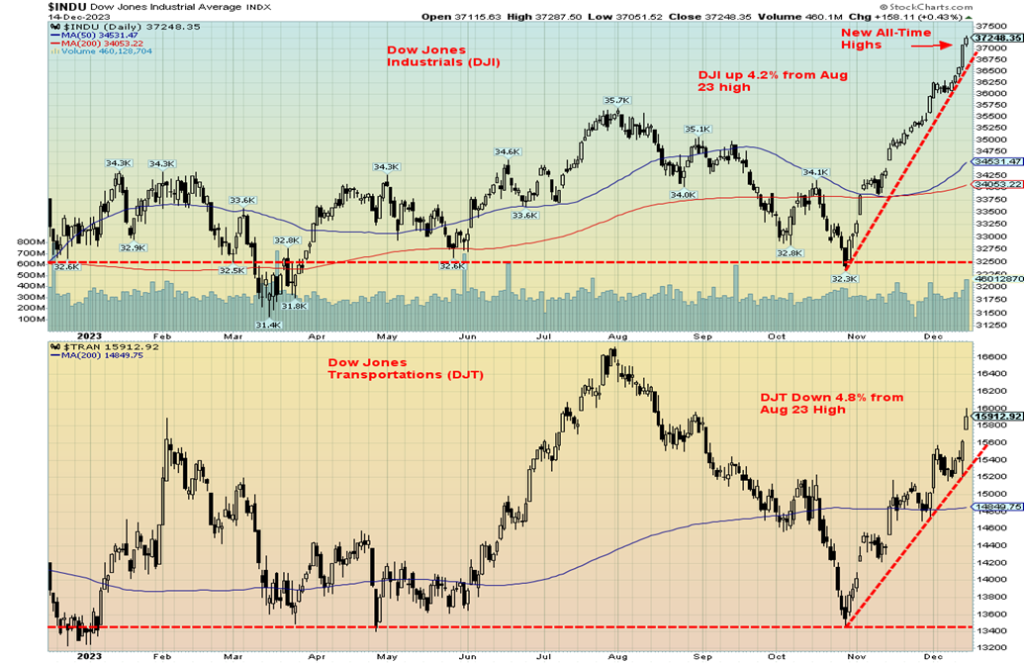
It is not as if the sharp divergence between the DJI and DJT is it. The S&P 500 (SPX) has gained 22.9%, but the S&P 500 Equal Weight is up only 10.2%. Big difference when the Magnificent Seven are treated the same as the worst performing stock in the S&P 500.
Yale Hirsch, the founder of the Stock Traders Almanac (www.stocktradersalmanac.com), devised a few interesting indicators. First and foremost was the January Barometer (devised in 1972). The barometer says that, as January goes, so goes the year. Since 1950 it has only 12 significant errors for an incredible 83.6% accuracy ratio. January 2023 saw a gain of 6.2% for the S&P 500 (SPX) and SPX is due for a solid gain in 2023. January’s first five days are billed as an early warning system. The first five days early warning system has an 83% accuracy ratio since 1950. The first five days of January 2023 saw SPX gain 1.4%. 2023 is headed for a solid gain.
The final one of what is being billed as a trifecta is the Santa Claus rally. The Santa Claus rally is considered to be the last five trading days of the year, combined with the first two trading days of the New Year. When all three indicators are combined and all three are positive, the accuracy rate leaps to 90.3% for the SPX. Only three years failed: 1966 (Vietnam War), 2011 (barely – the EU/Greek crisis), and 2018 (Fed quantitative tightening or QT). No surprise then that the trifecta for 2023 was all positive and the year is destined to end positive. What’s key then is to watch if all three indicators are negative or one or two are negative. The year tends then to be not so good.
Since 1950, we note five occasions where there was a down year followed by an up year. What followed was the next year was usually up as well. That record hints that 2024 could actually be an up year. The occasions where there was a down year followed by two up years were 1957, 1962, 1981, 2008, and 2018. Yes, despite the plunge in March 2020, the collapse was short-lived, thanks to slashing interest rates to zero and supplying oodles of cash, both fiscal and monetary.
The market was simply not allowed to fall. Today, the Fed and other central banks have a lot less wiggle room to act as they did after the financial crash of 2008 and the pandemic of 2020. Their ability to respond is limited because of the already extremely high amount of debt outstanding. Debt has been piled on top of debt and in the U.S. the interest bill for the Federal government approaches $1 trillion.
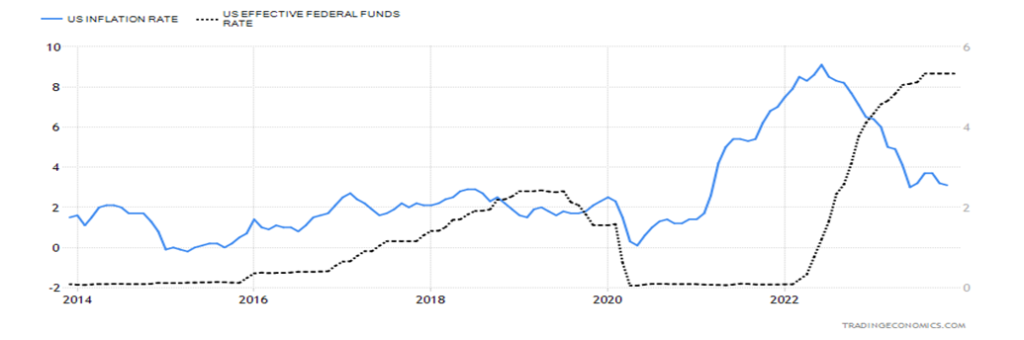
The Fed hiked interest rates four times in 2023, including February, March, May, and July. Each time it was 25 bp, bringing the Fed rate to 5.25%–5.50%. The Fed’s rate hikes, coupled with quantitative tightening (QT), has worked as inflation has fallen from a peak of 8.9% in June 2023 to the current 3.1%. In Canada, it is the same. Inflation peaked in June 2023 as well at 8.1% and today it is last at 3.1%. For the U.S., the Fed Funds rate at 5.25%–5.50% is now higher than the inflation rate. Ditto in Canada.
Yet, despite the hiking of interest rates and quantitative tightening, the stock market is not only up on the year, but recent action is more in keeping with what happened in 2020 when the SPX soared 120% from the March 2020 low to the peak in January 2022. So far, the SPX is up about 15% from the October 2023 low.
One of the reasons fueling the rally is that the Fed and other central banks have allowed bank reserves to expand. The result is that financial institutions, flush with cash and now expecting the Fed to pause, have a lot more capital to employ into the market. Given that the Fed is pausing and may even bring rate cuts, institutions are expecting the inevitable soft landing. With the extra funds, they are being somewhat aggressively redeployed into the stock markets and, to a lesser extent, the bond market. The result is 52-week highs in a number of indices (and individual stocks) and all-time highs for the DJI.
The latest from the Fed at its December 12–13, 2023 meeting saw them leave rates unchanged, as was widely expected. They noted that inflation had tempered but there remained inflation risks. However, they hinted that they might cut rates three times in 2024. That sparked a 500+ rally for the DJI and sent gold soaring. Three cuts of 25 bp each would lower the Fed rate to 4.75%.
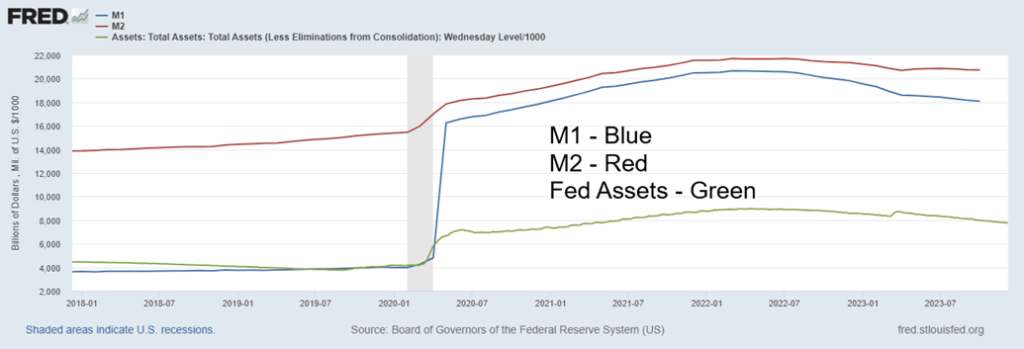
Money supply and the Fed’s balance sheet have also been falling. M1 money supply is down $2.5 trillion since peaking in 2022, while M2 has fallen $944 billion. The Fed’s balance sheet has contracted $1.2 trillion. Despite all this, in the U.S.—against the backdrop of the Russia/Ukraine war and the Israel/Hamas war—the economy has grown and the stock markets are up on the year. Canada is showing signs of slipping into a recession and the EU, led by Germany, also appears to be falling into a recession. Still, the German DAX like the DJI, recently made all-time highs.
U.S. Inflation Rate vs. U.S. Effective Fed Funds Rate 2013–2023
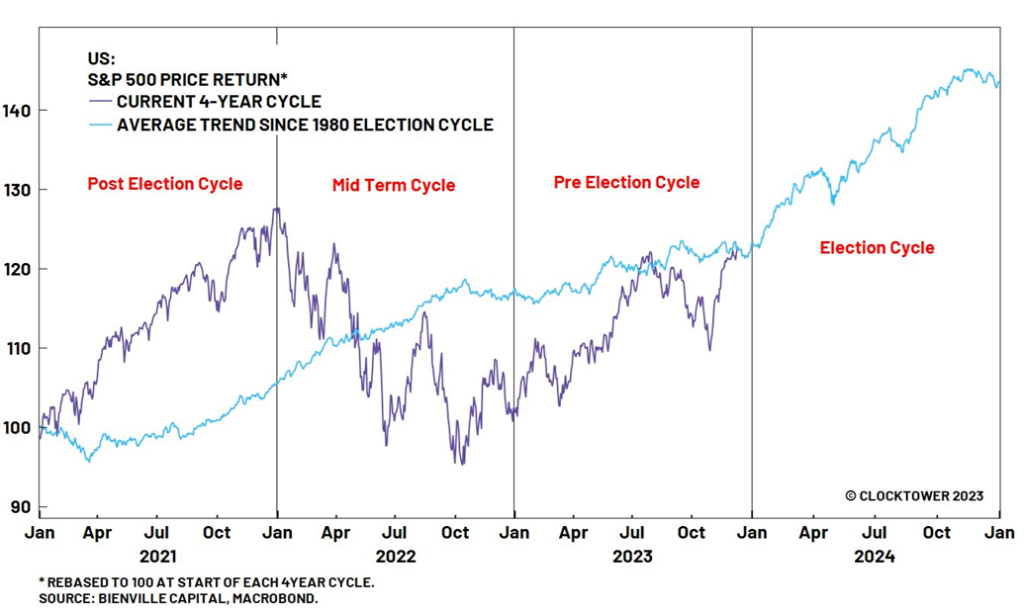
The U.S. presidential cycle is well known. Historically, the gains of the last two years of the cycle have dwarfed the gains of the first two years. The post-election year is the worst, with an average gain of only 3.3% over the past 190 years. The record is 23 up years and 24 down years. The midterm year is marginally better with an overall 3.8% return, as there were 28 up years and 20 down years.
However, in the pre-election year, the return is 10.4% as there were 35 up years and 12 down years. This year adds to the up years. Finally, during the election year, the return is 6% with 32 up years and 15 down years. Could it be that that they want to improve election chances by having the stock market go up over the final two years of the cycle?
U.S. Money Supply M1 M2 and Fed Assets 2018–2023 $billions
The markets have defied predictions that they would falter, given geopolitical concerns. They haven’t. Since the outbreak of the Russia/Ukraine war, oil prices spiked but have since collapsed. Markets have gone up, not down. The German DAX and the DJI made all-time highs. The Israel/Hamas war has had absolutely no impact on markets. Even the chaos in the U.S. Congress over a speaker and now the possible impeachment of president Biden has not shaken the markets.
The question is, will the 2024 election have an impact? The election could be hotly contested. There appears to be a good chance there could be more than two viable candidates to consider. That could complicate things. As we know, the election of the president turns on the electoral college, not the popular vote.
Two recent elections where a candidate won the popular vote but lost the electoral college vote were 2000 (Bush/Gore) and 2016 (Trump/Clinton). Many are expecting violence leading up to the election. That remains a possibility. Culture wars dominate. The foreign wars could take a different turn. Any one of them could result in what we call a “black swan” event, meaning an event that comes out of the blue that nobody expected.
The question might be, how will the Fed react in 2024? There are seven Fed meetings in 2024, the first being January 30–31. Many are expecting the Fed to cut rates in 2024. Some are even expecting rate cuts in Q1. The odds of that happening have been downgraded because of the strong job numbers. The markets rallied strong in 2023 because of the “Magnificent Seven and expectations of a Fed rate cut. The odds of a rate cut are low as the Fed tends to be late and most likely won’t act unless the economy really falls into the tank. Still, the Fed has hinted at rate cuts for 2024.
The inverted yield curve continues to point to a potential severe recession, not the widely wished-for soft landing. The monstrous mountain of debt is also an unknown. There are signs of trouble in the debt market. Banks have gone under with a number of others on negative watch. The consumer is stretched and delinquencies and bankruptcies are rising. The commercial real estate market continues to teeter and there have been bankruptcies. Many believe the commercial real estate market is a ticking time bomb.
We have not had a Lehman Brothers moment. Could we? Problems continue with sovereign debt as a number of countries are technically bankrupt or are just outright bankrupt. Ecuador, Tunisia, Ukraine, Egypt, Ghana, Ethiopia, Sri Lanka, Belarus, Zambia, Argentina, Kenya, El Salvador, Pakistan and Nigeria all head a list of countries that are either bankrupt or on the brink. Russia defaulted, but it was an artificial default caused by U.S. sanctions. Russia is more than capable of staying current with its debt payments.
The Presidential Four-Year Cycle
The stock market rallying ahead of a severe recession is not unusual. We saw this with strong uptrends in 2001, 2008 and 2020 before the recession hit and the stock market tumbled. In 2001 the stock market fell about 32%, in 2008 about 54%, and 2020 37%. Careful what one wishes for.
The presidential cycle is pointing to a potential up market in 2024. The decennial cycle is also positive. Years ending in four have a record of 13 up and 6 down years. 2024 is also an election year and the last nine years ending in 4 that was also an election year saw a record of 7 up and 2 down. On average, they gained 9.1% for the year. Everywhere we look, the odds favour a good 2024.
The job market has been cooling as job openings fall. Continuing claims are rising. We’ve read about a number of layoffs but, so far, they have had only minimal impact on the overall job numbers. For job seekers, it is becoming harder to find a job. Things like the rise in severe storms, severe fires, floods, and other weather-related disasters have not had a huge impact on jobs.
However, the number of those unable to get insurance is rising and the cost of insurance against fires, floods, severe storms, etc., depending on where one lives, has become very expensive. Canadians are seeing the same thing. Flood insurance is difficult to get anywhere. Yet severe flooding has become somewhat common, along with severe fires.
There are quite a number of indicators pointing to the stock market hitting new all-time highs in 2024. Unless, of course, a black swan event occurs to change things (a good example of a black swan was the 2020 pandemic; others were the collapse of Lehman Brothers and 9/11).
10-Year Stock Market Cycle
Annual % Change in the Dow Jones Industrials Average*
Year of Decade
| Decades | 1st | 2nd | 3rd | 4th | 5th | 6th | 7th | 8th | 9th | 10th | |
| 1831–40 | -0.9 | 13.0 | 3.1 | -11.7 | -11.5 | 1.6 | -12.3 | 5.5 | |||
| 1841–50 | -13.3 | -18.1 | 45.0 | 15.5 | 8.1 | -14.5 | 1.2 | -3.6 | – | 18.7 | |
| 1851–60 | -3.2 | 19.6 | -12.7 | -30.2 | 1.5 | 4.4 | -31.0 | 14.3 | -10.7 | 14.0 | |
| 1861–70 | -1.8 | 55.4 | 38.0 | 6.4 | -8.5 | 3.6 | 1.6 | 10.8 | 1.7 | 5.6 | |
| 1871–80 | 7.3 | 6.8 | -12.7 | 2.8 | -4.1 | -17.9 | -9.4 | 6.1 | 43.0 | 18.7 | |
| 1881–90 | 3.0 | -2.9 | -6.5 | -18.8 | 20.1 | 12.4 | -8.4 | 4.8 | 5.5 | -14.1 | |
| 1891–00 | 17.6 | -6.6 | -24.6 | -0.6 | 2.3 | -1.7 | 21.3 | 22.5 | 9.2 | 7.0 | |
| 1901–10 | -8.7 | -0.4 | -23.6 | 41.7 | 38.2 | -1.9 | -37.7 | 46.6 | 15.0 | -17.9 | |
| 1911–20 | 0.4 | 7.6 | -10.3 | -5.4 | 81.7 | -4.2 | -21.7 | 10.5 | 30.5 | -32.9 | |
| 1921–30 | 12.7 | 21.7 | -3.3 | 26.2 | 30.0 | 0.3 | 28.8 | 48.2 | -17.2 | -33.8 | |
| 1931–40 | -52.7 | -23.1 | 66.7 | 4.1 | 38.5 | 24.8 | -32.8 | 28.1 | -2.9 | -12.7 | |
| 1941–50 | -15.4 | 7.6 | 13.8 | 12.1 | 26.6 | -8.1 | 2.2 | -2.1 | 12.9 | 17.6 | |
| 1951–60 | 14.4 | 8.4 | -3.8 | 44.0 | 20.8 | 2.3 | -12.8 | 34.0 | 16.4 | -9.3 | |
| 1961–70 | 18.7 | -10.8 | 17.0 | 14.6 | 10.9 | -18.9 | 15.2 | 4.3 | -15.2 | 4.8 | |
| 1971–80 | 6.1 | 14.6 | -16.6 | -27.6 | 38.3 | 17.9 | -17.3 | -3.1 | 4.2 | 14.9 | |
| 1981–90 | -9.2 | 19.6 | 20.3 | -3.7 | 27.7 | 22.6 | 2.3 | 11.8 | 27.0 | -4.3 | |
| 1991–00 | 20.3 | 4.2 | 13.7 | 2.1 | 33.5 | 26.0 | 22.6 | 16.1 | 25.2 | -6.2 | |
| 2001–10 | -7.1 | -16.8 | 25.3 | 3.1 | -0.6 | 16.3 | 6.4 | -33.8 | 18.8 | 11.0 | |
| 2011–20 | 5.5 | 7.3 | 26.5 | 7.5 | -2.2 | 13.4 | 25.1 | -5.6 | 22.3 | 7.2 | |
| 2021–30 | 18.7 | -8.8 | 22.9 * | ||||||||
| 11 up 8 dn | 11 up 8 dn | 9 up 10 dn | 13 up 6 dn | 15 up 4 dn | 11 up 8 dn | 10 up 9 dn | 14 up 5 dn | 13 up 5 dn 1 flat | 11 up 8 dn |
* To date
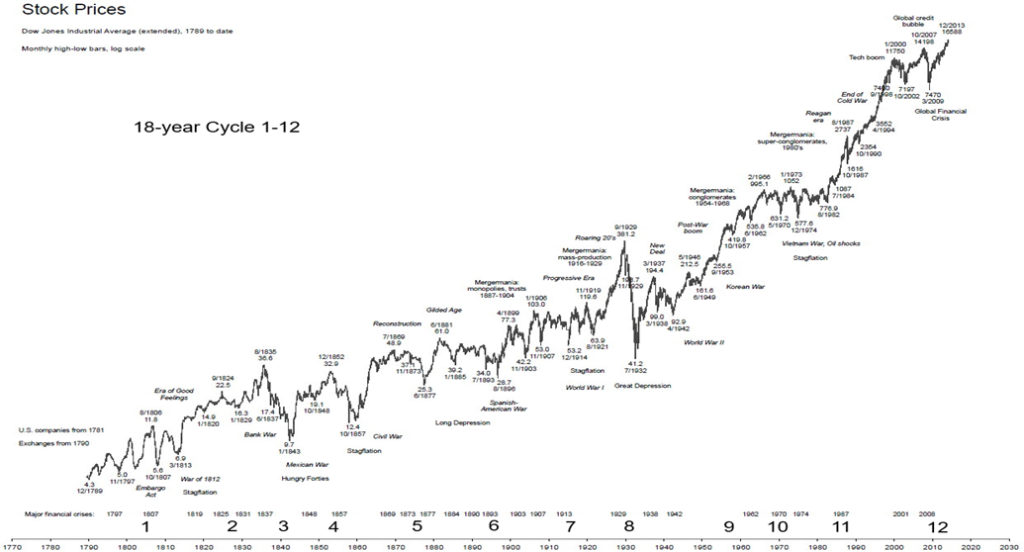
Since we follow cycles, we should note the 18-year cycle. The 18-year cycle for stocks has a range of 13–21 years. The last one bottomed in March 2009. The next one is due in 2022–2030.
Our long-term chart of the DJI (shown on the following pages) from 1789 shows that we’ve had 12 18-year cycle lows: 1807, 1829, 1843, 1857, 1877, 1896, 1914, 1932, 1949, 1970, 1987, and 2009. Note how it caught the Great Depression low of 1932 and the stock market crash of October 1987. The 18-year cycle usually breaks down into two 9-year cycles (range 7–11 years) or three 6-year cycles (range 5–7 years).
Since the 2009 low, we had the low in 2020 (11 years) as well a low in 2015 (6 years), and then the low in 2020 (5 years). The next 9-year cycle low is due in 2027–2031 while the next 6-year low is due in 2025–2028. So, we have a lot of overlap fitting with the next 18-year cycle low. The low, we believe, may not come until 2025. Nonetheless, we appear destined to enter a difficult market as we go into 2024. Or will it hold off for another year?
The Soaring DJI 2021–2023
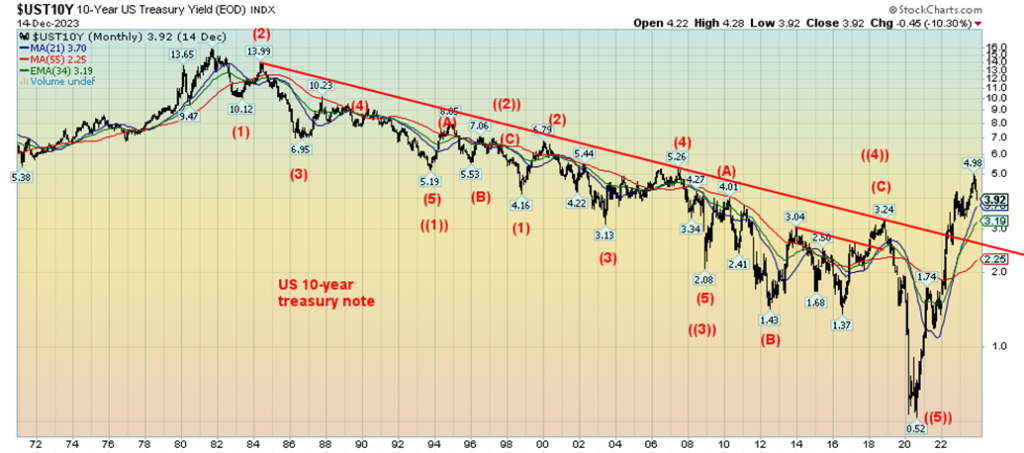
Interest rates have been falling, particularly rates at the long end of the market. The long end of the bond market is where mortgage rates are set. The expectation from many is that interest rates are likely to keep on falling from the 1981 low. However, the downtrend from that 1981 yield high was busted in 2022. That tells us that the huge rally in bond yields is over. Here is a chart of the U.S. 10-year treasury note yields, showing that yields have busted the 20+ year downtrend line.
According to our wave count, we have completed five wave downs from the yield peak in 1981. We’ve previously noted the bond cycles. A six-year bond cycle (from a larger 18-year cycle) may have topped with the 10-year at 4.98. The previous yield peak was seen in 2018. If the wave that started from a low of 0.52% in 2020 to the peak in 2023 of 4.98% is a corrective wave to the long-yield decline, then what we are seeing now is a correction to the run-up to 4.98%. Key support zones can be seen at 3.92% (achieved), 3.27%, 2.75%, and 2.22%. Only below 1.57% could the 2020 low of 0.52% be challenged. Our moving average lines show support at 3.20% and 2.25%, with the old trend line around 2.60%. Test of the breakout line is not unusual.
U.S. 10-Year Treasury Note Yields 1971–2023
Long Term DJI chart follows
Dow Jones Industrials (DJI) 1789–2013
Numerous signs point to 2024 being a positive year for the stock market. The wild card is an unknown—a black swan event that could change everything. The risks are there. But will they translate into a systemic shock and a resulting bear market? Could the current market be in a bubble that is about to burst? Interest rates have fallen, but what’s key going forward is the Fed. Will they cut in 2024 as they hinted? If so, when will they cut and by how much? More likely are cuts in the latter part of the year. More evidence is needed on the economy to suggest that we’ll have a soft landing rather than a hard one.
Interest rates are down, but for how much longer? Unless the Fed cuts rates sooner rather than later. And inflation abates even further. At 3.1%, we are getting close to the Fed’s 2% target. The rally today is being fueled by large financial institutions. And already we have extreme overbought signs and the Fear/Greed Index has flipped to extreme greed. The January effect, the first five days, and the Santa Claus rally are coming. But if Santa should fail to call, bears may come to Broad and Wall.
Weekly Summary
Markets soared again this past week. New highs were seen for a number of indices, with the DJI making record highs. The rise since October 2023 has been literally straight up. Is this a bubble? Bubbles always burst. Could the life of this bubble be approaching its bursting point? This is all happening as we approach the start of the January effect and the Santa Claus rally.
On the week, the S&P 500 rose 2.5% making new 52-week highs, the DJI made new all-time highs, rising 2.9%, the DJT rose 5.3% but remains well down from its highs and the August high, and the NASDAQ gained 2.9% to 52-week highs. The S&P 400 (Mid) rose 4.3% while the S&P 600 (Small) was up 5.8%. Both made 52-week highs. Is the market broadening out the sign of a strong market? Or are they just latecomers? The reality is that the markets are grossly overbought. We’ve never seen the DJI with an RSI over 80 for such an extended period.
In Canada, the TSX was more subdued, up only 1.0%, while the TSX Venture Exchange (CDNX) continued its woes, falling 1.2%. Information Technology TKK made 52-week highs, while the best performing sub-index was Health Care THC, up 3.5%. The big loser was Telecommunications TTS, down 3.9%. Could the TSX be failing that trendline again? If so, it does not bode well going forward.
In the EU, the London FTSE gained 0.3%. But the stars were on the continent as the Paris CAC 40 was up 0.9%, the German DAX actually was off about 0.1%, and the EuroNext gained 1.0%. However, all three made not just 52-week highs but new all-time highs. Recession in the EU? According to the stock markets, maybe not so much.
In Asia, China’s Shanghai Index (SSEC) continued its woes, losing 0.9%, the Tokyo Nikkei Dow (TKN) was up 0.4%, while Hong Kong’s Hang Seng (HSI) rose 2.8%. The MSCI World Index was up 2.9%. Elsewhere, Bitcoin faltered, falling 4.1%.
U.S. indices and EU indices making all-time highs appear to be in a bubble. When does it burst?
Gold and Precious Metals
Did Santa Claus come early for gold and gold stocks? That is something we need to consider, given the response this past week for gold, silver, and gold stocks after the Fed meeting on December 12–13. As we noted earlier, the Fed rate as expected was unchanged. Fed Chair Powell noted that inflation remains a concern, but then he hinted at the magic words: rate cuts, potentially three of them in 2024. Stocks soared, gold soared, bond yields fell (prices that move inversely to yield rose) and the US$ Index fell. Happy Days are here again.
Well, maybe. For the stock market, it appears to be in a bubble. For gold and the precious metals, they could be ready to explode to the upside. While gold made new all-time highs on December 4, 2023, it was short-lived as sellers took advantage of the overnight spike and unloaded, creating what appears to be a key reversal day on the charts. But to confirm the key reversal, gold must fall for a period and lose at least 10–15%. So far, we have fallen only about 8%. Any upside move that moves beyond $2,120 sets up the potential for new all-time highs.
The trouble with gold is it has been the only one of the precious metals that has made fresh all-time highs. Silver is nowhere near its all-time high, close to $50. Platinum is even worse. Near PMs such as palladium and copper are also well down from their all-time highs. Applying Dow Theory to the PMs means that they are not confirming each other. Who’s wrong? Gold also made all-time highs in a number of other currencies. But no, none of the other PMs or near PMs have made all-time highs in other currencies.
We have noted that gold has some history of making a bottom in December. December 2015 and 2016 both come to mind. In 2016 gold was up 8.6% and in 2017 gold jumped 13.7%. A low here in December followed by new highs would be very positive going into 2024. All the reasons to hold gold remain—as a haven from geopolitical concerns, domestic political concerns, and falling fiat currencies, and as a means of maintaining purchasing power in the face of inflation, low bond yields, and solvency of governments.
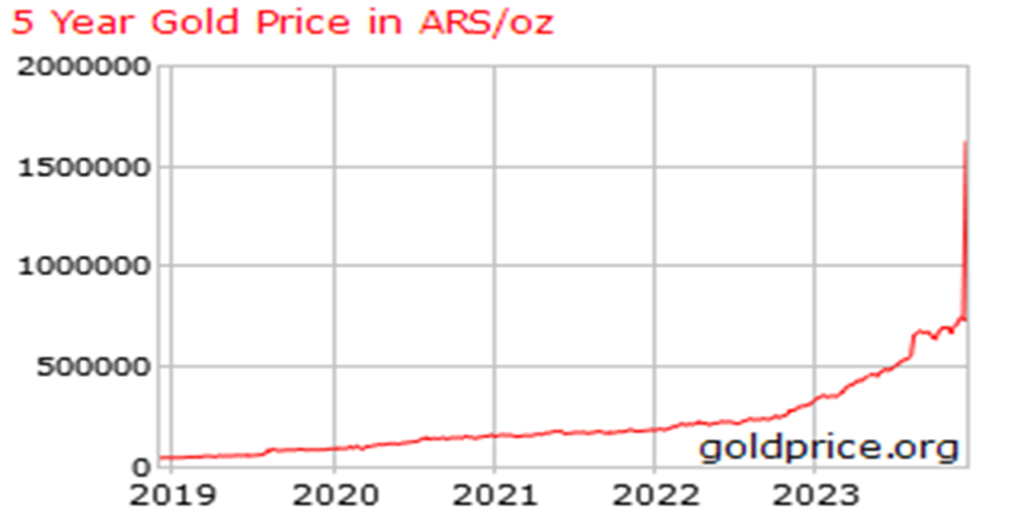
Gold has been around as money and currency for over three thousand years. All previous periods of fiat currencies failed. With the world leaving the gold standard in August 1971, we are in a period of fiat currencies. Fiat currencies have an intrinsic value of zero. They are nothing more than government IOUs and are worth only what the government tells you they are worth. Note that Argentina is going through a major currency, inflation, and debt crisis. But gold in Argentinian pesos has soared, up 120% in the past week alone.
Gold in Argentina Pesos 2019–2023—up, up, and away!
The world’s largest consumers of gold are China and India, accounting for more than half the annual consumption. Central banks have remained net buyers of gold, led by the People’s Bank of China (PBOC) and the Bank of Russia (BOR). Today, the world’s central banks hold some 35,827.5 metric tonnes of gold. The U.S. is the largest holder with 8,133.5 metric tonnes. Rounding out the top five holders are Germany with 3,352.6 metric tonnes, the IMF with 2,814.0 metric tonnes, Italy 2,451.8 metric tonnes, and France 2,436.9 metric tonnes.
Russia holds 2,332.7 metric tonnes and China holds 2,214.6 metric tonnes. They rank 6th and 7th in the world. That’s the official holdings. Unofficially, many believe both have a lot more. China, Australia, and Russia are the top three gold producers in the world. Canada is number four. Why do Russia and China hold so much gold and why are they adding to it? They may be planning to back their currencies with gold, thus protecting the value of the ruble and the yuan.
Canada has no official gold reserves, having dumped all theirs back in 2016. Globally, including jewelry, gold held as an investment, central bank gold, and, gold in industrial uses, it is estimated that all the gold in the world totals some 192,000 metric tonnes but could be as high as 210,000 metric tonnes.
Free-trading gold has only been around since the 1970s. So, we don’t have a long history. Our history of the 10-year decennial gold cycle only starts from the 1970s. As a result, there are not a lot of observations. This does make our decennial count somewhat suspect but interesting. The best period was the 1970s when gold soared from $35 to about $873.
There have been 33 up years and 23 down years, not counting this year which should finish up. Years ending in 4 have been mixed, with 2 up years and 3 down years. Presidential election years have a record of 7 up and 6 down. The last five presidential election years have been up. As to years ending in 4 and a presidential election, there have only been two: 1984 and 2004. The record is 1 up, 1 down.
10-Year Gold Cycle
Annual % Change in Gold
Year of Decade
| Decades | 1st | 2nd | 3rd | 4th | 5th | 6th | 7th | 8th | 9th | 10th |
| 1961–70 | -0.5 | 10.7 | 6.2 | -8.9 | ||||||
| 1971–80 | 16.5 | 48.9 | 75.6 | 60.6 | -23.3 | -3.8 | 23.4 | 36.5 | 134.8 | 10.9 |
| 1981–90 | -32.5 | 12.7 | -14.4 | -20.0 | 6.9 | 23.1 | 20.1 | -15.7 | -1.8 | -1.6 |
| 1991–00 | -10.6 | -5.9 | 17.6 | -1.9 | 1.0 | -4.9 | -21.5 | -0.2 | 0.1 | -6.0 |
| 2001–10 | 2.6 | 24.8 | flat | 25.6 | 18.2 | 22.8 | 31.4 | 5.8 | 23.9 | 29.8 |
| 2011–20 | 10.2 | 7.0 | -28.2 | -1.5 | -0.4 | 8.6 | 13.7 | -2.1 | 18.9 | 24.4 |
| 2021–30 | -3.5 | -0.1 | 11.5 * | |||||||
| 3 up 3 dn | 4 up 2 dn | 3 up 2 dn | 2 up 3 dn | 3 up 2 dn | 3 up 2 dn | 4 up 2 dn | 3 up 3 dn | 5 up 1 dn | 3 up 3 dn |
* To date
Possibly more important are gold cycles, as outlined by Ray Merriman of Merriman Cycles (www.mmacycles.com). Merriman’s longest gold cycle (with very limited observations) is one of 23.5 years. It only has two observations—1976 and the double bottom of 1999 and 2001. The next one is due in 2022–2025. It is possible we made that low in November 2022 at $1,618.30. The breakout to new highs seems to confirm the low, but given the breakout was short-lived we’ll await a better confirmation to new highs.
The 23.5-year cycle breaks down into three cycles of 7.83-years. The last confirmed 7.83-year cycle low was at $1,045 in December 2015. The next one is due October 2023 +/- 8 months February 2023-June 2024. The last significant low was October 2023 at $1,824. Breaking down the 7.83-year cycle are three cycles of roughly 31.3-months (range 26–37 months) or two cycles of roughly 47 months (range 42–52 months). Following the December 2015 low, we note important lows in September 2018 (33 months) at $1,167 then again in August 2021 (35 months).
We also note the March 2020 low which came 51 months following the December 2015 low. That one was most likely the 47-month low. The next 31.3-month cycle would be due October 2023 to July 2024. The low in October 2023 at $1,824 could satisfy that cycle low. Again, confirmation of new all-time highs would go a long way in confirming these lows, even as they do not line up cleanly. Failure to confirm this high could suggest we have another down wave coming into 2024. However, it would be the final wave down. Thus, the importance of moving now to new all-time highs above the spike on December 4 at $2,152.
Silver does not exactly follow gold, but silver and gold do tend to move together, both up and down. However, silver tends to lead. If silver is not leading, it is a possible divergence. Gold stocks also need to lead. But stocks have been performing poorly for quite some time, given that the gold/HUI ratio is still very high, suggesting gold is expensive relative to the gold stocks. Following the sharp reversal day on December 4, gold has fallen to date 7.7%, silver is down 13.5%, and the Gold Bugs Index (HUI) has dropped 11.2%. Our preference, if we want the bullish case, would have been for both, or at least one of them, to not fall as far as gold.
For years, many gold watchers have been pointing out what appear to be large cup and handle formations on both gold and silver. Both patterns remain unrealized, despite gold jumping to new highs on December 4. It remains inconclusive. Gold still needs to make convincing new highs that are sustained while all silver has to do is to break out over $26 and hold it, then make new highs above the February 2021 high of $30.35. So far, both levels have remained elusive. Nonetheless, the cup and handle pattern remains compelling but unfulfilled.
The corollary to the cup and handle is that we are instead forming a symmetrical triangle top that breaks to the downside. We don’t expect that, but note that a break of gold $1,618 and silver around $17.50 could trigger more losses. The uptrend lines are tight. Gold below $1,800 and silver under $22 could also be dangerous. Our chart of gold and silver is on the next page.
Gold Silver 2009–2023

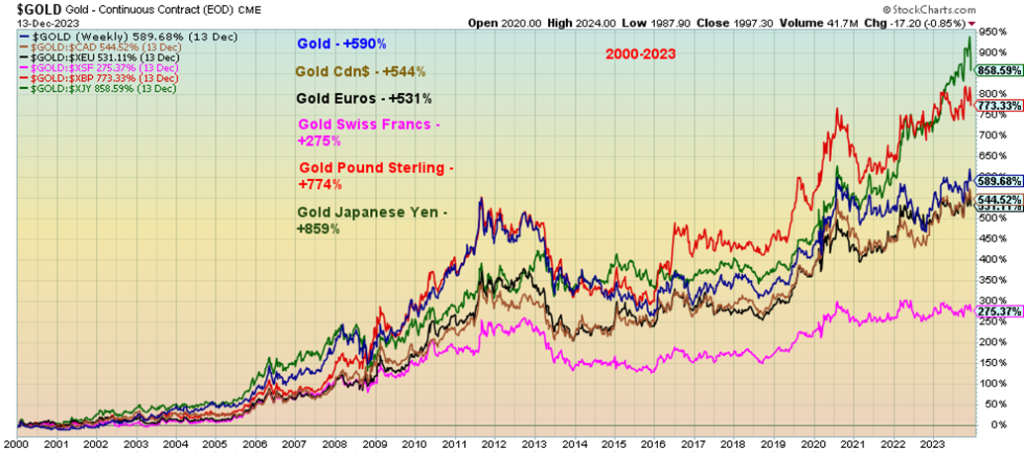
Gold has been rising in all currencies. The chart next is for the main currencies that make up the US$ Index. Other currencies have seen bigger gains (Argentina Pesos). Since 2000, gold in Japanese yen leads the way with a gain of 859%. The biggest laggard is gold in Swiss francs, up only 275% in the same period. Gold (in US$) gained 590%. Gold is protection against declines in fiat currencies. And it is nobody’s liability.
Gold in Currencies Performance: 2000–2023
The case for a strong gold market, and by extension silver and the gold stocks, in 2024 appears to be good. But right now, we need to confirm the cycle lows with gold making and holding new all-time highs above $2,152. The bottom isn’t in if, for whatever reason, gold were to break down under first $1,935 (the November 2023 low) and then $1,824 (the October 2023 low). Otherwise, patterns plus weakening currencies, particularly the US$ Index, could send gold, silver, and the gold stocks to new heights in 2024.
As to other commodities, oil remains the most compelling as it is the one most used by consumers. Yet oil prices have been in the doldrums with no real catalysts from the wars in Ukraine and Israel. Of course, that could change, but overall demand is lagging and while OPEC+ have cut production, the U.S. is pumping to make up the difference. This week is seeing some upward movement in oil prices, thanks to the Fed pause along with a drop in U.S. inventories. The Houthis of Yemen have also fired on oil tankers in the Red Sea.
A number of companies are no longer allowing their ships to pass through the Red Sea on route to the Suez Canal. The Suez Canal is an important conduit for world trade and oil. Some 12% of global trade flows through the Suez Canal while 5% of the world’s oil, 10% of global oil products and 8% of LNG also passes through the Suez. Any prolonged blockage of the route could have a negative impact on global trade and oil prices. The Suez Canal is the third most important oil choke point behind the Straits of Hormuz (leading out of the Persian Gulf) and the Straits of Malaca (linking the Indian and Pacific Oceans). In terms of world trade the Suez Canal is the second most important transit route behind the Panama Canal.
Any prolonged blockage could have important ramifications for the world. Yet we read that the U.S. is considering attacking the Houthis of Yemen a move that could widen the war in the Mid-East which in turn could spark further blockages elsewhere.
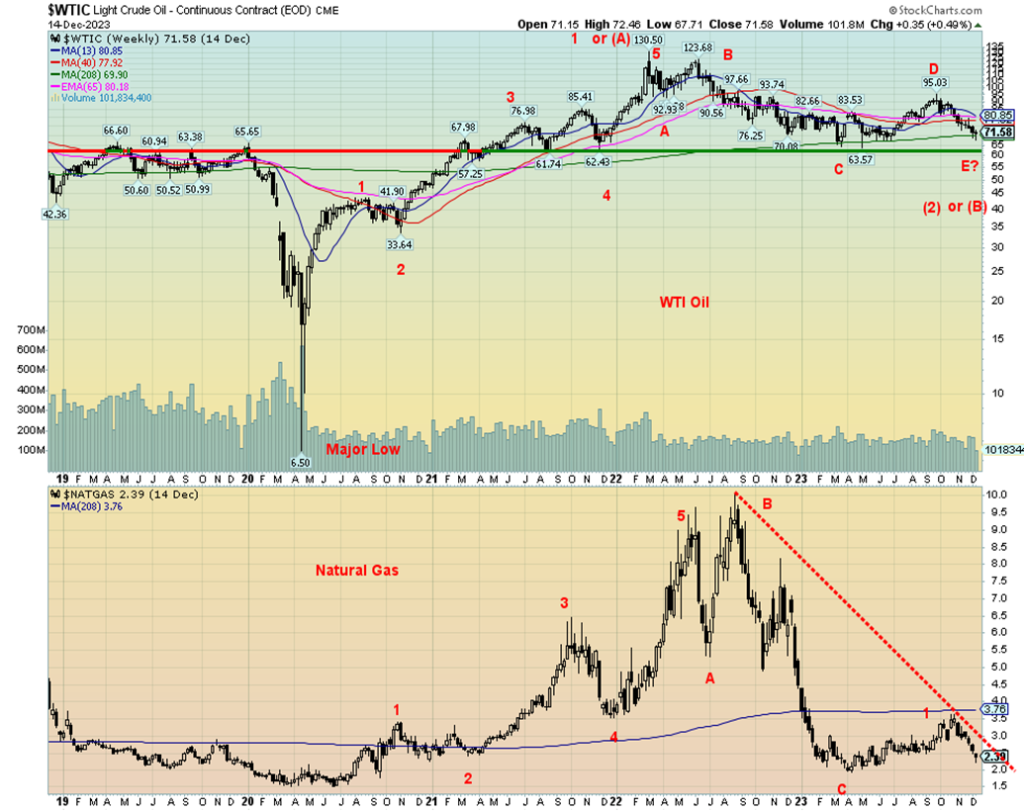
Our chart of both oil and gas shows that oil is down at what appears as a solid level of support. A break under $60 would, however, be dangerous. Following that major low in 2020, WTI oil appears to have made a five-wave advance to the peak in 2022. What has followed has unfolded in what looks like an ABCDE type of correction. If that’s correct, then we are close to the end of this correction. The next wave to the upside would get underway with a firm breakout over $85 and $90. Seasonals are also favourable. Natural gas (NG) stalled out at the 4-year MA and has since pulled back. Is this a 2-wave corrective? A firm breakout above $3.75 could start the next wave to the upside.
Oil & Gas 2019–2023
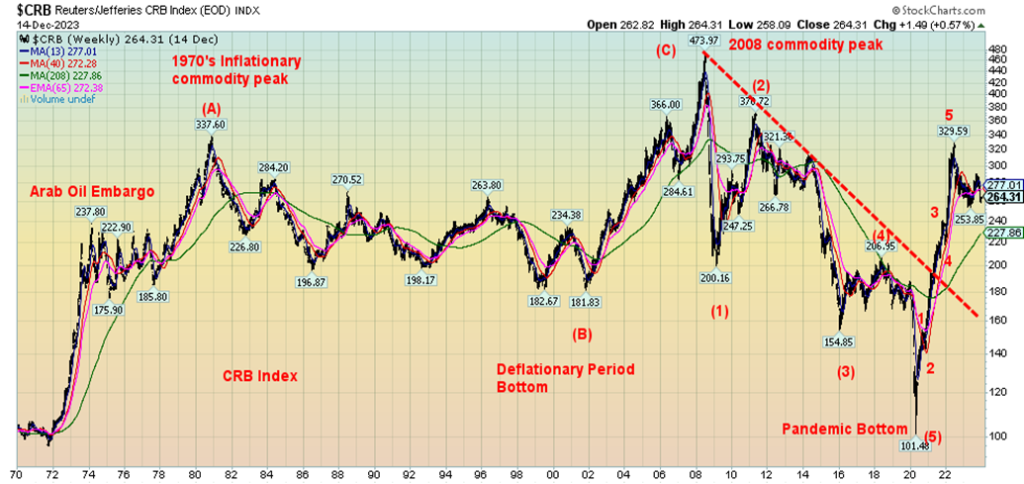
Many have talked about the commodity supercycle. We’ve outlined it before. But the reality is, the CRB Index is made up of 41% agriculture and 39% energy. The rest is split between golds and metals. Oil and wheat play a bigger role than gold and uranium. Our 50+ year chart of the CRB Index shows that we broke that long downtrend from the last commodity supercycle top seen in 2008. Oil topped in 2008 and gold topped in the secondary wave correction labeled (2) in 2011. Commodities do not top and bottom at the same time.
Since the first peak came in 2022, we are now going through a correction to the large wave up from the 2020 pandemic low. Once this wave is complete, we could start a powerful wave to the upside. It could start in 2024. It would be confirmed with a firm breakout of the previous high at around 330. While helpful to have all commodities rising, it is not essential.
CRB Index 1970–2023
Weekly Summary
Markets rebounded this past week. Gold gained 1.7%, silver was up 3.7%, and, platinum jumped 3.6%. Palladium soared, gaining 26.4%, thanks to the dovish Fed and it raised the outlook for the auto sector. Russia is the world’s largest producer of palladium followed by South Africa (both BRICS countries). Everybody else is way behind. The largest consumers of palladium are China, U.S. and the EU. Russia holds the largest reserves. Copper jumped 1.6%. The Gold Bugs Index (HUI) was up 4.0% while the TSX Gold Index (TGD) gained 2.8%.
WTI Oil gained 0.8%, while Brent crude was up 0.9%. Natural gas (NG) fell 3.5%, while EU NG at the Dutch Hub fell 14.0%. Blame the warm weather. The ARCA Oil & Gas Index (XOI) was up 2.9%, but the TSX Energy Index (TEN) fell 1.9%.
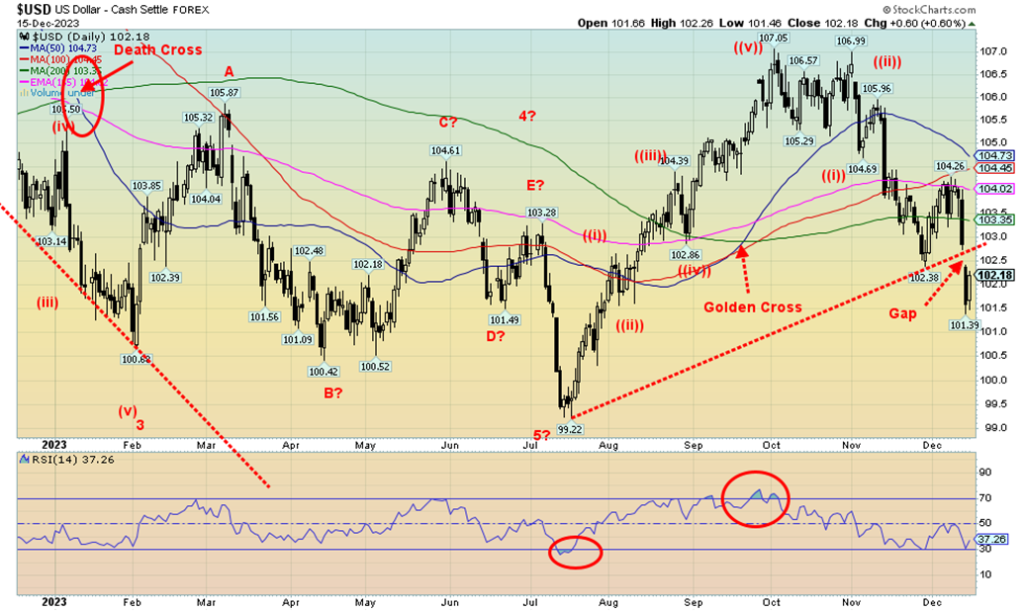
For currencies, the US$ Index was hit following the dovish talk from the Fed, gapping down and falling 1.7%. The US$ Index gapped under 103 and now appears to be headed lower, unless that gap can be quickly filled. The US$ Index has turned negative on the year. That’s positive for gold. The euro was up 1.2%, the Swiss franc up 1.1%, the pound sterling gained 0.2%, and the Japanese yen continued its recent recovery, up 1.9%. The Cdn$ also gained, up 1.8%.
US$ Index
Conclusions
All the indicators for the stock markets appear positive as we head into 2024—the presidential cycle, the decennial effect. However, the markets have been on what appears to be a bubble rise. We have never seen a bubble that didn’t burst. Severe overbought signals are being seen on a number of indices and non-confirmation divergences have been appearing between the indices.
Coming up are the early indicators: the January effect, the first five days of the New Year, the Santa Claus rally. If they stay positive, then 2024 could, like 2023, be a good year. But if they turn negative and the bubble bursts, then 2024 could prove to be a down year and a continuance of the bear market that started in 2022. The next month could be the key to the rest of the year. We are also wary of the possibility of a black swan event taking place in 2024. Certainly, the dangers are there with wars, geopolitical tensions, domestic polarization, and extreme weather.
There remains huge potential in the commodity markets, particularly gold and oil. Both appear to be poised for a good 2024. There are caveats, particularly for gold, but with the US$ Index appearing to break down that is a positive sign for gold. The days of buying gold for below US$2,000 may soon be behind us. But the other PMs need to catch up. The failure of silver to confirm gold’s high has always been a red flag. For oil, the wild card is
the wars in the Middle East and Russia/Ukraine. Either one, but the Middle East in particular, could be the catalyst for a big jump in oil prices.
As 2024 approaches, we are wary about the stock market, but holding a bit of gold might be a wise idea. High interest rates are bringing destabilization to consumers, corporates, and governments alike as delinquencies and bankruptcies rise. This could hasten in 2024. And political polarization continues, which could still upend elections.
Markets & Trends
| % Gains (Losses) Trends | ||||||||
| Close Dec 31/22 | Close Dec 15, 2023 | Week | YTD | Daily (Short Term) | Weekly (Intermediate) | Monthly (Long Term) | ||
| Stock Market Indices | ||||||||
| S&P 500 | 3,839.50 | 4,719.19 (new highs) | 2.5% | 22.9% | up | up | up | |
| Dow Jones Industrials | 33,147.25 | 37,305.16 (new highs) | 2.9% | 12.5% | up | up | up | |
| Dow Jones Transport | 13,391.91 | 16,016.11 | 5.3% | 19.6% | up | up | up | |
| NASDAQ | 10,466.48 | 14,813.92 (new highs) | 2.9% | 41.5% | up | up | up | |
| S&P/TSX Composite | 19,384.92 | 20,529.15 | 1.0% | 5.9% | up | up | up | |
| S&P/TSX Venture (CDNX) | 570.27 | 530.85 | (1.2)% | (6.9)% | up | down | down | |
| S&P 600 (small) | 1,157.53 | 1,290.88 (new highs) | 5.8% | 11.5% | up | up | neutral | |
| MSCI World | 1,977.74 | 2,214.99 | 2.9% | 12.0% | up | up | neutral | |
| Bitcoin | 16,531.31 | 42,189.90 | (4.1)% | 155.2% | up | up | up | |
| Gold Mining Stock Indices | ||||||||
| Gold Bugs Index (HUI) | 229.75 | 238.60 | 4.0% | 3.9% | up | neutral | down (weak) | |
| TSX Gold Index (TGD) | 277.68 | 284.52 | 2.8% | 2.5% | up | neutral | down (weak) | |
| % | ||||||||
| U.S. 10-Year Treasury Bond yield | 3.88% | 3.91% | (7.6)% | 0.8% | ||||
| Cdn. 10-Year Bond CGB yield | 3.29% | 3.13% | (7.4)% | (4.9)% | ||||
| Recession Watch Spreads | ||||||||
| U.S. 2-year 10-year Treasury spread | (0.55)% | (0.54)% | (10.2)% | 1.9% | ||||
| Cdn 2-year 10-year CGB spread | (0.76)% | (0.82)% | (6.5)% | (7.9)% | ||||
| Currencies | ||||||||
| US$ Index | 103.27 | 102.18 | (1.7)% | (1.1)% | down | down (weak) | up (weak) | |
| Canadian $ | 73.92 | 74.90 | 1.8% | 1.3% | up | up (weak) | down | |
| Euro | 107.04 | 108.96 | 1.2% | 1.8% | up | up (weak) | down (weak) | |
| Swiss Franc | 108.15 | 114.86 | 1.1% | 6.2% | up | up | up | |
| British Pound | 120.96 | 126.79 | 0.2% | 4.8% | up | up | neutral | |
| Japanese Yen | 76.27 | 70.36 | 1.9% | (7.8)% | up | neutral | down | |
| Precious Metals | ||||||||
| Gold | 1,826.20 | 2,035.70 | 1.1% | 11.5% | up | up | up | |
| Silver | 24.04 | 24.15 | 3.7% | 0.5% | up | neutral | up (weak) | |
| Platinum | 1,082.90 | 952.60 | 3.6% | (12.1)% | up | neutral | down | |
| Base Metals | ||||||||
| Palladium | 1,798.00 | 1,202.40 | 26.4% | (33.1)% | up | down | down | |
| Copper | 3.81 | 3.89 | 1.6% | 2.1% | up | up (weak) | neutral | |
| Energy | ||||||||
| WTI Oil | 80.26 | 71.78 | 0.8% | (10.6)% | down | down | neutral | |
| Nat Gas | 4.48 | 2.49 | (3.5)% | (44.4)% | down | down | down | |
New highs/lows refer to new 52-week highs/lows and, in some cases, all-time highs.
Copyright David Chapman 2023
__
(Featured image by Mohamed_Hassan via Pixabay)
DISCLAIMER: This article was written by a third party contributor and does not reflect the opinion of Born2Invest, its management, staff or its associates. Please review our disclaimer for more information.
This article may include forward-looking statements. These forward-looking statements generally are identified by the words “believe,” “project,” “estimate,” “become,” “plan,” “will,” and similar expressions. These forward-looking statements involve known and unknown risks as well as uncertainties, including those discussed in the following cautionary statements and elsewhere in this article and on this site. Although the Company may believe that its expectations are based on reasonable assumptions, the actual results that the Company may achieve may differ materially from any forward-looking statements, which reflect the opinions of the management of the Company only as of the date hereof. Additionally, please make sure to read these important disclosures.
David Chapman is not a registered advisory service and is not an exempt market dealer (EMD) nor a licensed financial advisor. He does not and cannot give individualised market advice. David Chapman has worked in the financial industry for over 40 years including large financial corporations, banks, and investment dealers. The information in this newsletter is intended only for informational and educational purposes. It should not be construed as an offer, a solicitation of an offer or sale of any security. Every effort is made to provide accurate and complete information. However, we cannot guarantee that there will be no errors. We make no claims, promises or guarantees about the accuracy, completeness, or adequacy of the contents of this commentary and expressly disclaim liability for errors and omissions in the contents of this commentary. David Chapman will always use his best efforts to ensure the accuracy and timeliness of all information. The reader assumes all risk when trading in securities and David Chapman advises consulting a licensed professional financial advisor or portfolio manager such as Enriched Investing Incorporated before proceeding with any trade or idea presented in this newsletter. David Chapman may own shares in companies mentioned in this newsletter. Before making an investment, prospective investors should review each security’s offering documents which summarize the objectives, fees, expenses and associated risks. David Chapman shares his ideas and opinions for informational and educational purposes only and expects the reader to perform due diligence before considering a position in any security. That includes consulting with your own licensed professional financial advisor such as Enriched Investing Incorporated. Performance is not guaranteed, values change frequently, and past performance may not be repeated.


TopRanked.io Weekly Affiliate Digest: What’s Hot in Affiliate Marketing [Changelly Affiliate Program]
It's official. TikTok is (potentially) dead. And, if you believe the news, that's gonna destroy thousands of small businesses and...


Terre et Lac Launches Crowdfunding for a Photovoltaic Power Plant
Terre et Lac, a Lyon-based company, launches a crowdfunding campaign for a solar plant in Voreppe. Residents of Isère and...


Qonto, Ledger, and Younited Credit, Leading Trio of the French Fintech Ecosystem
Qonto emerges as the top fintech in the latest rankings after its successful Series D funding. The 2024 Fintech 100...


Cannabis Clubs: Germany Introduces Strict Regulations
Germany introduces new regulations aimed at tightening control over cannabis clubs, following recent reforms. The Cannabis Act (CanG) allows limited...


Merck Invests Over 300 Million Euros in a New Research Center in Germany
Merck invests over 300 million euros in a new biotech research center in Germany, part of a larger 1.5 billion...
 |
|
 |  |
 |
|
-

 Impact Investing6 days ago
Loyal Is Working on a Drug to Extend the Life of Dogs
-

 Crowdfunding2 weeks ago
4fund.com, a Polish Crowdfunding Portal Which Has Raised 275 Million Enters the Italian Market
-

 Fintech3 days ago
Konvex Created the First Universal API that Integrates Different ERPs in Latin America
-

 Business1 week ago
What You Can Do to Create an Online Store People Trust