Featured
Are these extreme market events signalling the coming of the bear market?
In the previous week, the Dow Jones set two new all-time highs, closing at 5.55 percent.

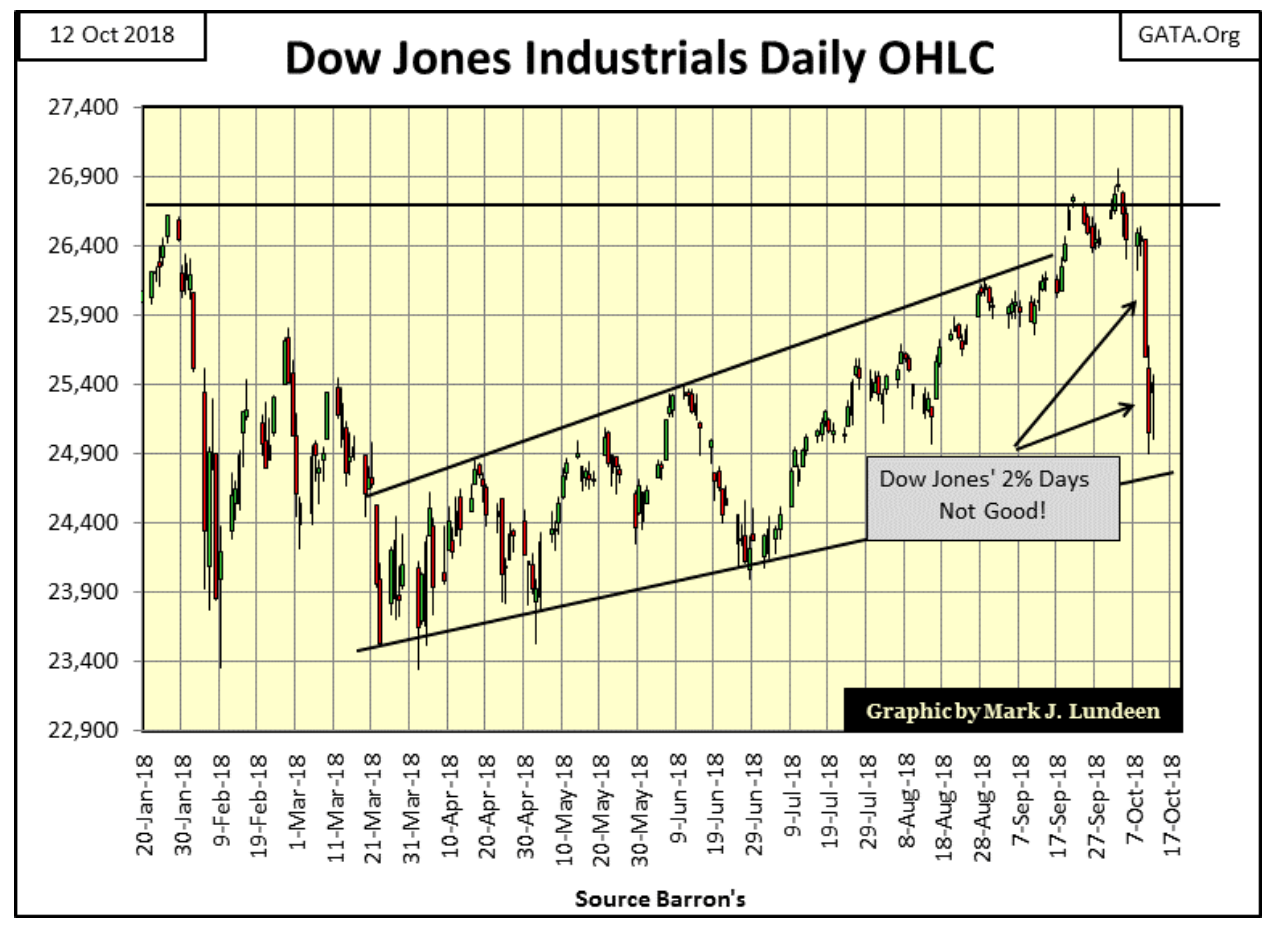
Do you want to see something really ugly? Look no farther than the daily bar chart for the Dow Jones below.
© Mark Lundeen
Yep, Mr. Bear was a bad bear this week! Jeeze Louise, the Dow Jones saw two new all-time highs last week yet closed this week down 5.55 percent from them. This decline may not sound very dramatic until you look at the Dow Jones’ BEV chart below. The Dow hasn’t been below its BEV -6.25 percent line since July; where it then took the bulls three months to make a few BEV Zeros (all-time highs). In the past week, Mr. Bear gate crashed the festivities, clawing back over half the gains of the past three months with just a few swipes of his massive paws.
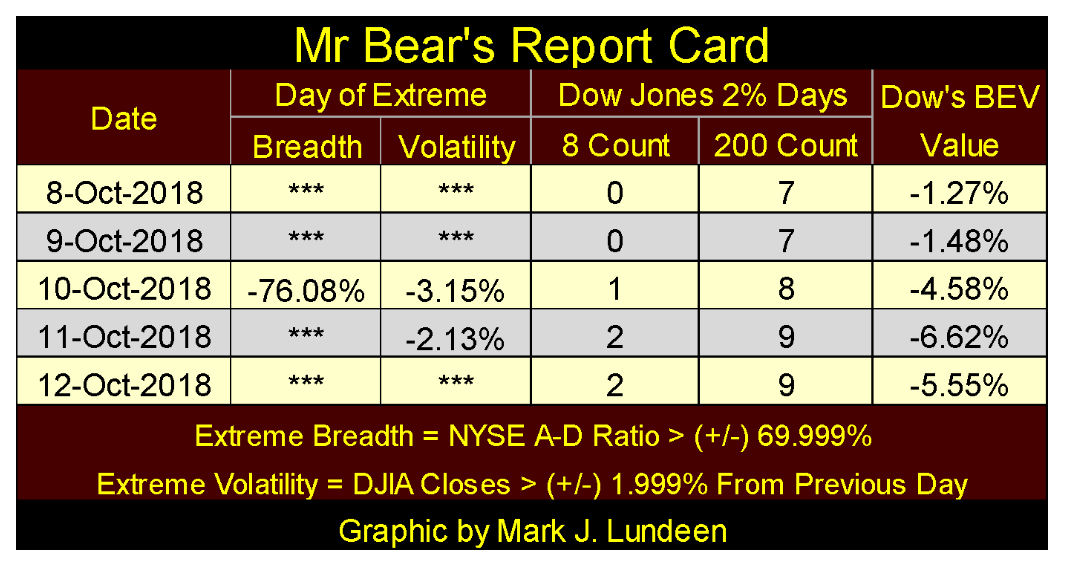
The worse day of the week was Wednesday; the Dow Jones closed down 4.58 percent in the BEV chart. Thursday was a bad day too, taking the Dow Jones 6.62 percent from the highs of last week, and then on Friday saw a nice 1.15 percent recovery. Not that a nice one-day recovery in a market that sees two Dow Jones 2 percent days (days of extreme volatility) are necessarily bullish. See Mr. Bear’s report card below for the daily specifics.

© Mark Lundeen
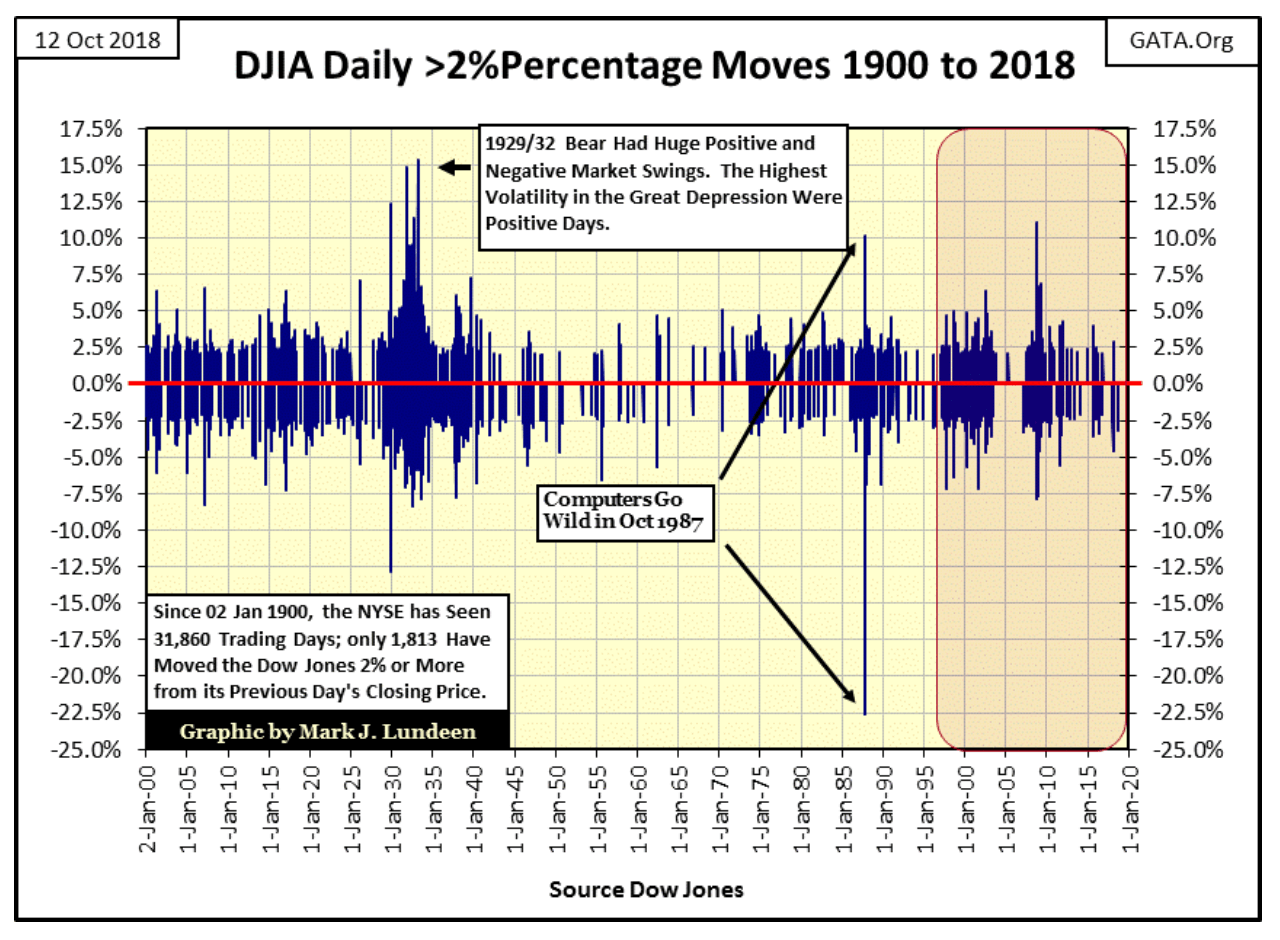
The best one-day recoveries in history occurred during the Great Crash of the early 1930s, as seen below. In fact, the largest daily moves during the Great Depression were advances, hard to believe but true.
Also note during the Dow Jones second deepest bear market, the Sub-Prime Mortgage bear market (October 2007- March 2009), there were no daily double-digit percentage declines, but on Monday 13 October 2008, the Dow Jones saw a daily advance of 11.08 percent. “Market experts” everywhere cheered, but the bear market didn’t hit bottom until March 2009.
To have an appreciation of the frequency the Dow Jones sees days of extreme volatility, since 02 January 1900, almost 119 years, the NYSE has seen 32,155 trading sessions, of which the Dow Jones has moved more than (+/-) 2 percent from a previous day’s close in only 1,822 of them. So they are infrequent market events, and almost exclusively bear market events.
© Mark Lundeen
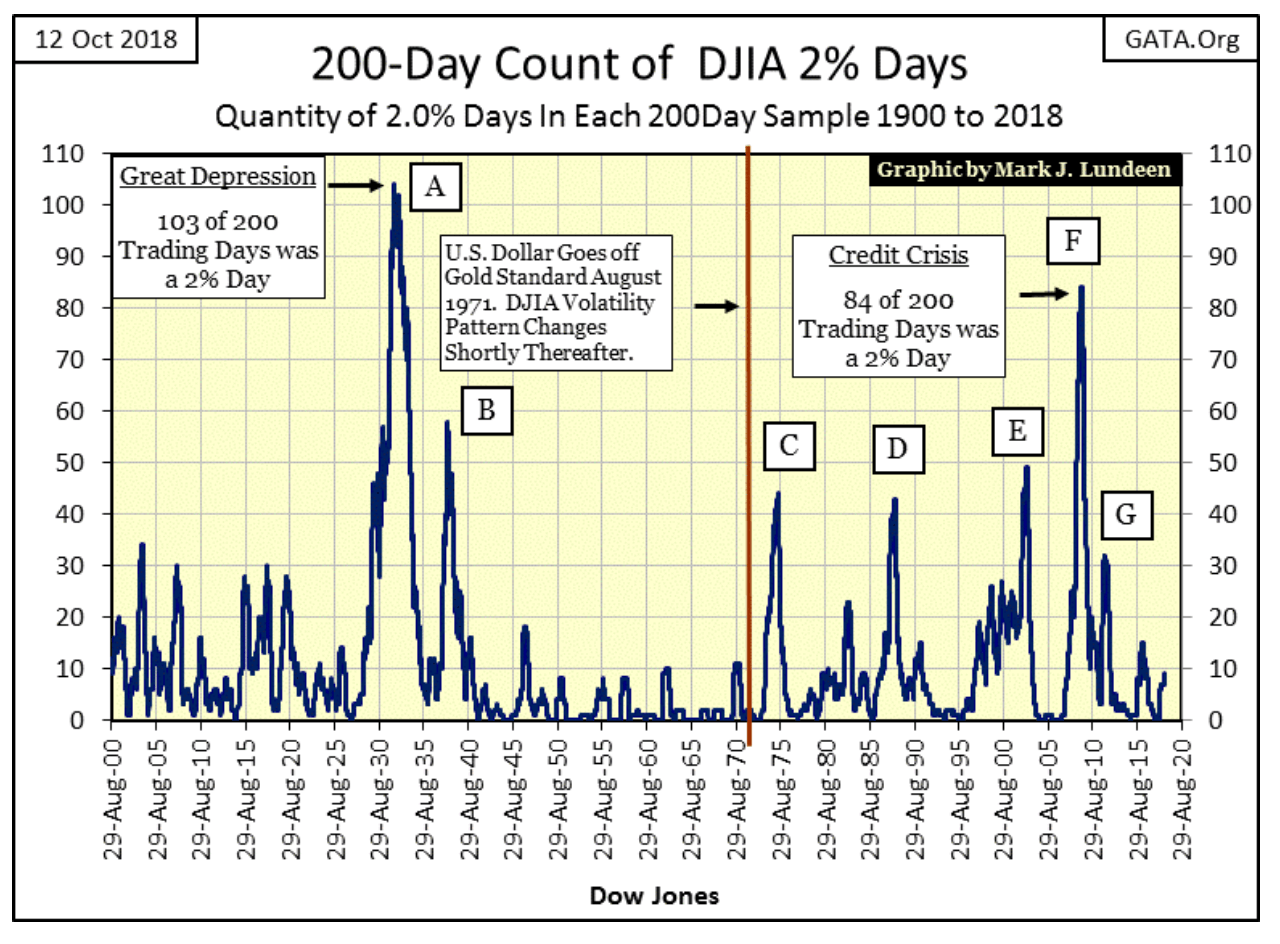
To render the above data in a more digestible format, I’ve constructed what I call the 200 count below, where a 200-day running sample counts the number of Dow Jones 2 percent days (data from above chart). With the exception of G below, these spikes in extreme volatility were destructive market events for retail investors.
The Dow’s 200 count is currently building a new spike. So far, it’s climbed to nine 2 percent days in a running 200-day sample. But if Mr. Bear is here to stay, it will rise to much higher levels before he is finished with his business on Wall Street. When it climbs above 20, I’ll label it H.
© Mark Lundeen
The NYSE this week also saw a day of extreme market breadth, a.k.a. an NYSE 70 percent Day. On Wednesday, the NYSE had the following breadth statistics:
Advance: 342
Decline: 2,686
Unch: 53
TTL Shares Traded 3,081
Below I show my math for Wednesday’s NYSE 70 percent day
342-2686/3081= -76.08 percent
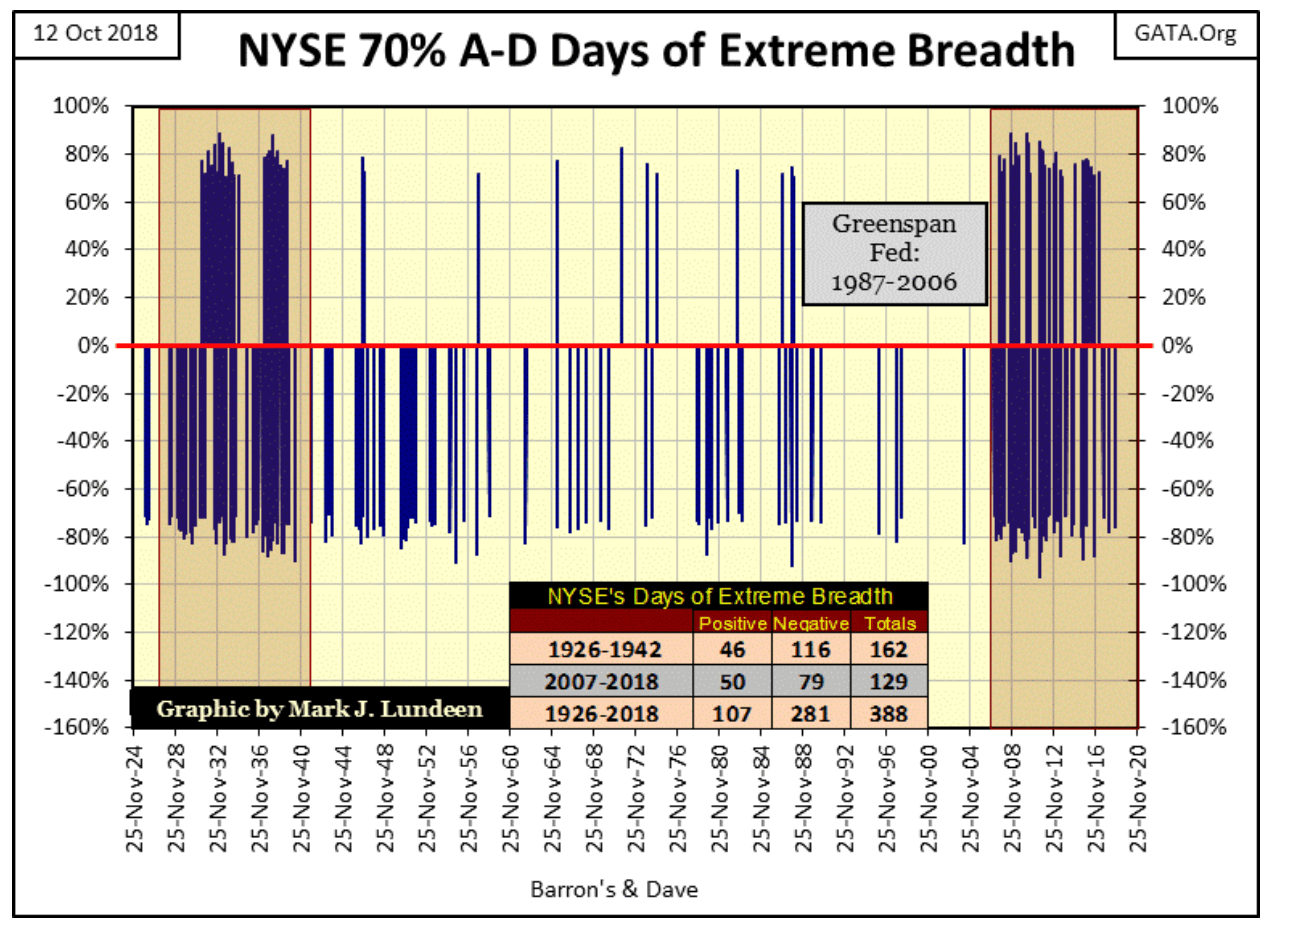
NYSE 70 percent days (Days of Extreme Market Breadth) are very rare market events. My data begins on 02 January 1926; since then, the NYSE has seen 24,487 trading sessions, of which only 388 has seen a 70 percent day as computed above. As with Dow Jones 2 percent days, NYSE 70 percent days are basically bear market events be they positive or negative 70 percent days.
The most interesting feature in the chart below are the clusters of 70 percent days that formed during the depressing 1930s, and the current cluster that began in February 2008 and continues to this day.
© Mark Lundeen
Looking at the 92 years of market history in the chart above, one has to wonder why since February 2008 has the NYSE seen so many days of extreme market breadth? Take a moment and study this chart. Obviously, since February 2008, just shortly before Bear Stearns (the big Wall Street bank went bust), something fundamental in the stock market has changed and it wasn’t for the better.
Here’s Mr. Bear’s report card. With his NYSE 70 percent and Dow Jones 2 percent days on Wednesday, and another Dow 2 percent day on Thursday, I’d give him a failure, but it would only encourage him.
© Mark Lundeen
These were negative market events; big down days in the Dow Jones, days where advancing issues were overwhelmed by decliners, events where “market experts” on CNBC were greatly distressed. But if you study the charts above, you see that during big bear markets, like in the 1930s and again during the 2007-09 bear market, these metrics will also produce big positive days too.
Mr. Bear has no friends. He’s out to destroy wealth, even for short sellers who timed their positions incorrectly. Seeing the Dow Jones advance over 10 percent in a single day could ruin them. But realizing how since 1900 (for the past 118 years), such days are to be expected in big bear markets. Waiting for an outsized daily advance as a trigger to short the market (or purchases a put option) is a very prudent market strategy. Just realize you’re dealing with a wild animal—Mr. Bear, and he has no love for you.
IF we are entering into a bear market, we’ll see more of these extreme market events, both negative and positive in the months to come, and I will be following them closely.
The 8 count is the number of Dow Jones’ 2 percent contained in an eight-day sample. Why an eight-day count, why not a seven or 10-day count? During the 1930s, this indicator peaked at eight Dow Jones 2 percent days in a row. If in the years ahead of us we should see nine straight days of extreme volatility in the Dow Jones, I’ll make this my 9 Count.
The 200 count is the number of Dow Jones 2 percent days in a 200-day running sample (covered in comments above). Most of the current nine in the count occurred from last January to April and so are getting stale. Come next month, they will begin to fall outside the 200-day sample, and we’ll see the count decline. That is unless we see more 2 percent days in the months to come.
Will we? Looking at the NYSE 52Wk Highs and Lows data below, it’s better than house odds bet that we’ll see more extreme market events in the weeks to come. That can’t be good for the Dow Jones. I say that because NYSE 52Wk Lows have been increasing in the past few weeks (see table below).
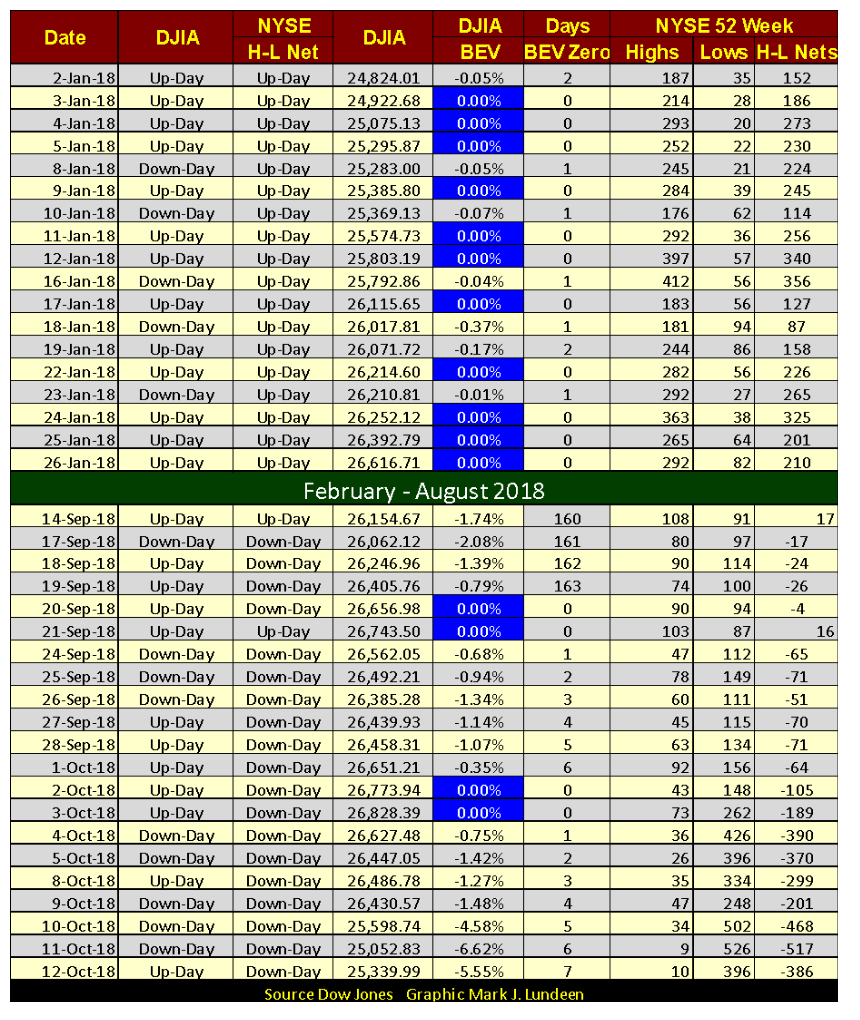
© Mark Lundeen
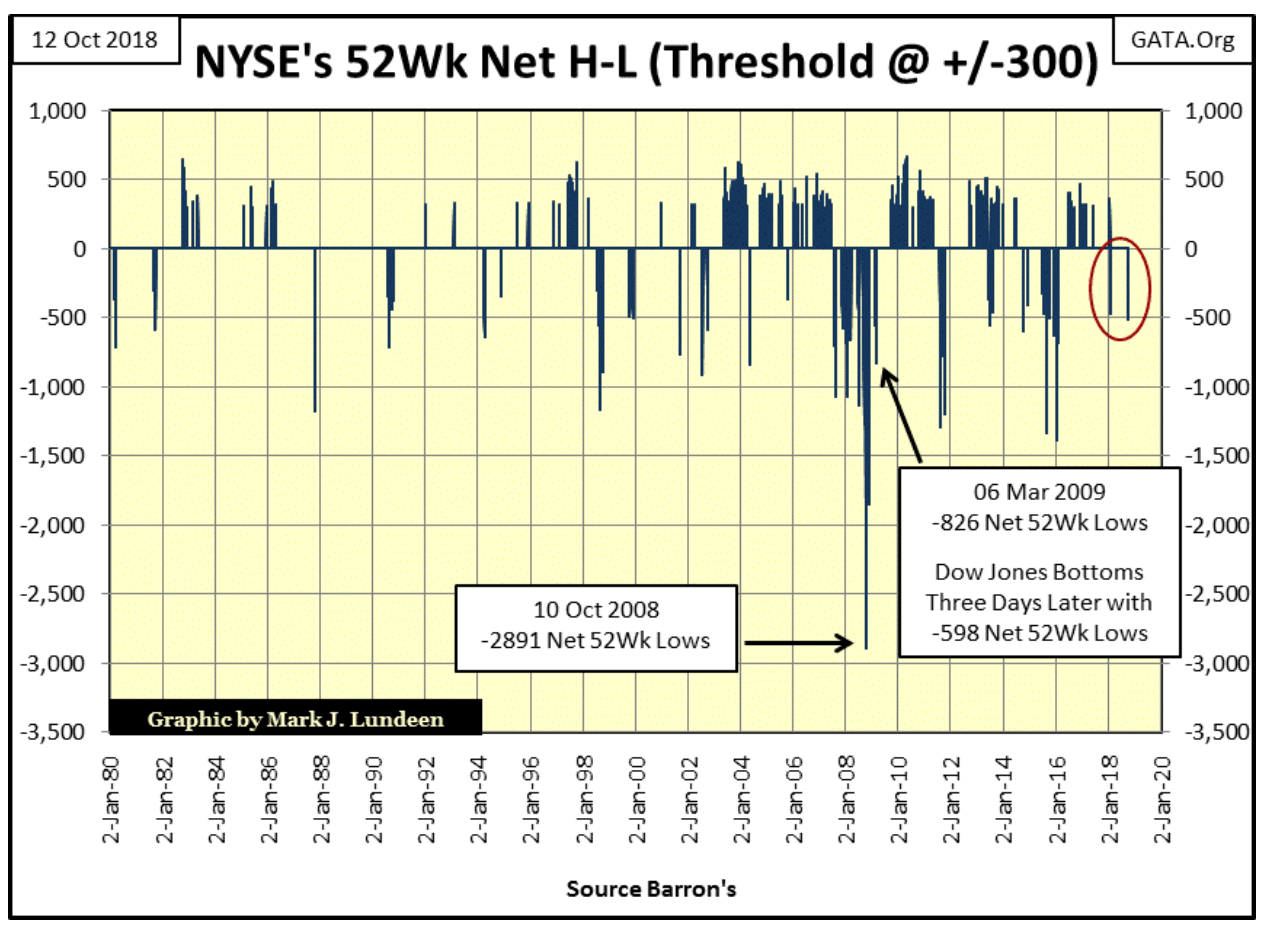
Here’s the chart for NYSE 52Wk H-L Nets seen in the far right column in the table above. Since 2008 (about the time the NYSE 70 percent days began their current cluster), once the Dow Jones begins to decline, the NYSE 52Wk H-Ls likes to peak with a net of something greater than -1,000. In the Red Circle, I’ve highlighted the maximum nets for last February and for this week, only a 52Wk H-L Net of around 500. But if you go back up to my BEV chart for the Dow Jones and see their correction lows for the summer of 2015 and February 2016, they both bottomed with NYSE 52Wk H-L Nets of more than -1,000, as seen below.
© Mark Lundeen
I’m not making a prediction here, but I expect the decline in the Dow Jones that began last week will continue until we see an NYSE 52Wk H-L net of something below -1,000. It will be a short-term climatic event, from which a significant dead cat bounce can be expected. From there, Mr. Bear will take the stock market down to its ultimate bear market low.
Should this bear market play out as I’ve suggested, it’s not from something I saw with my crystal ball. Big-bear markets, like big-bull markets, don’t run in a straight line from one extreme to the other. All major market moves take many years or even decades to play out, and they always see counter-cyclical corrections that create doubts in the minds of the bulls and bears alike.
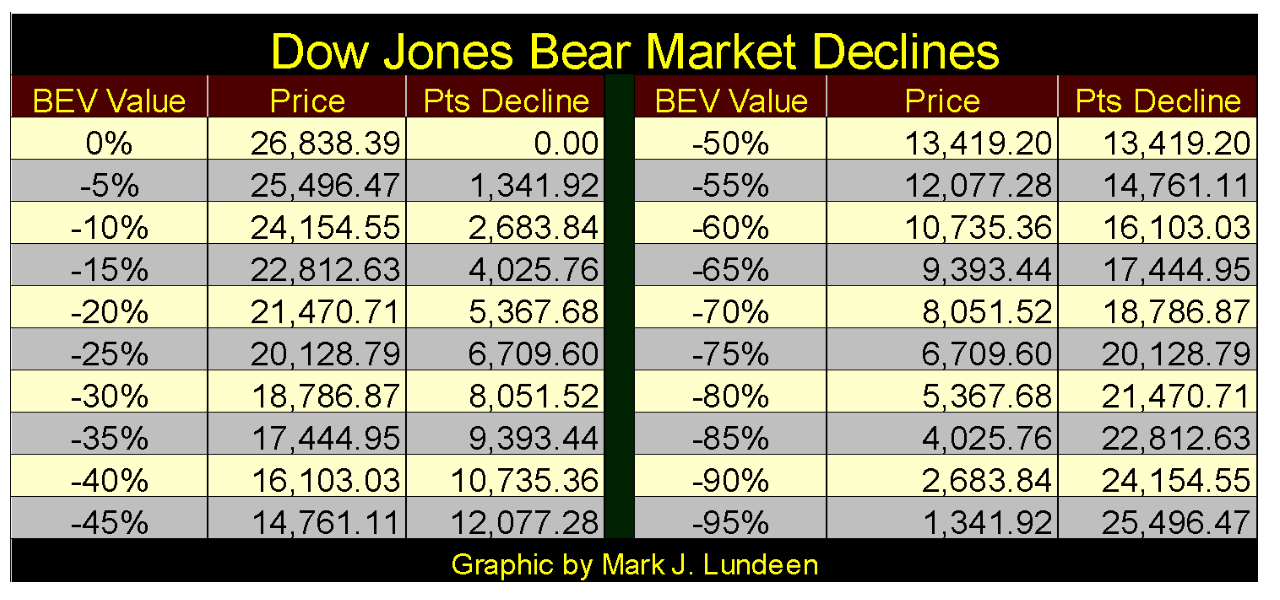
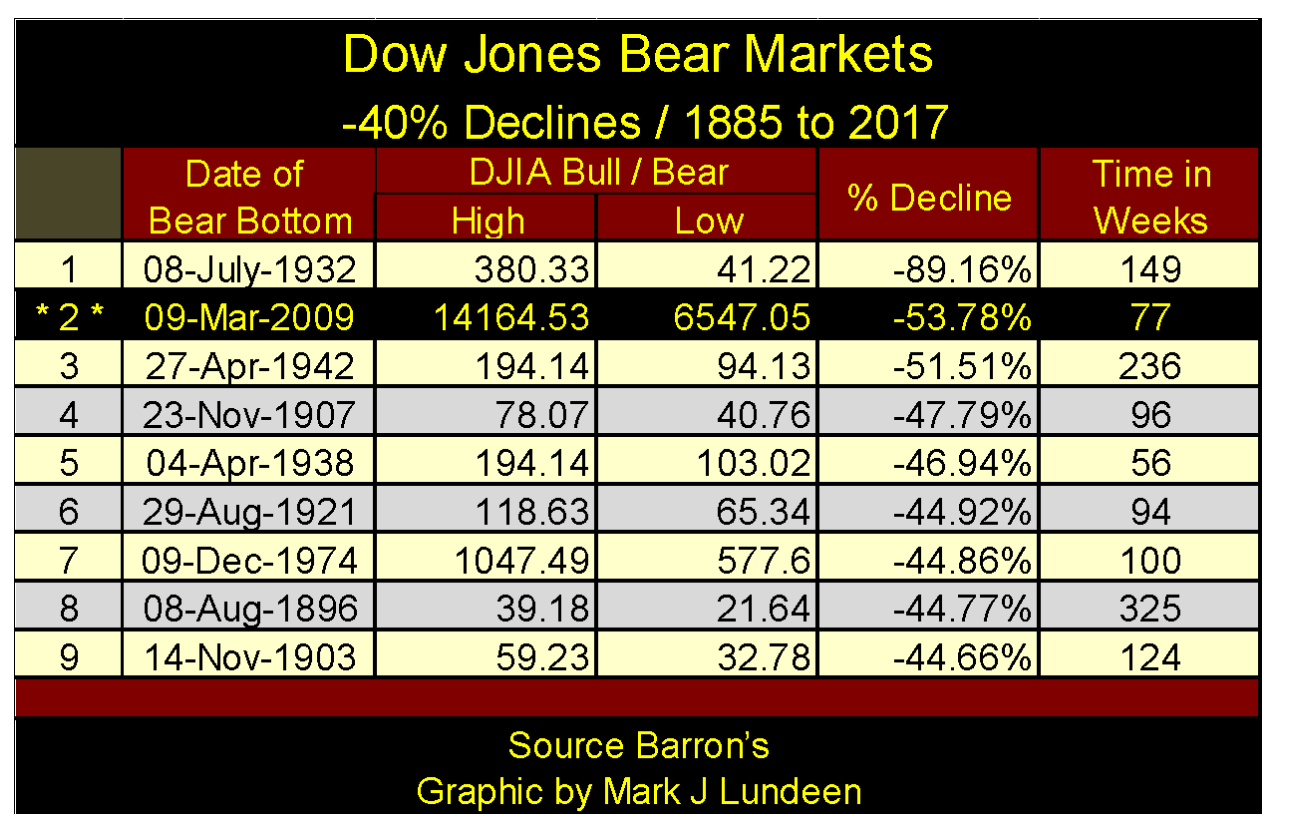
But I fear that the coming bear market is going to make history, possibly taking out the Great Depression Bear Market’s 89.19 percent decline in the Dow Jones. From the current bull market high of October 3rd, the following table lists the potential declines. Seeing the Dow Jones decline 40 percent from an all-time high is a BIG BEAR MARKET. For the Dow Jones to slip below 60 percent from an all-time high is a catastrophe.
Don’t make the mistake of believing the declining Dow Jones is responsible for any economic or social dislocation/business failures and massive unemployment. The responsible parties for that are the bungling corporate officers, Wall-Street Bankers, politicians and academicians who were tasked to train these people. The decline in the Dow Jones is only an honest measurement of the damage done to the financial system and its underlying economy by this motley crew.
© Mark Lundeen
Here’s a table listing the Dow Jones 40 percent bear markets. Since 1885 there have been nine of them. Considering all the garbage Mr. Bear and his cleanup crews have to remove from the financial system, and grossly inflated market values in investors’ stock and bond portfolios, before Mr. Bear is finished with his work I expect the coming bear market will finish in either the #1 or #2 position in the table below.
© Mark Lundeen
I believe that because the “policy makers” have burdened the financial system and its underlying economy with a massive amount of debt. And then there are the hundreds of trillions of dollars in notional value of OTC derivatives that are on the books of the big Wall Street banks and their client corporations.
It’s Mr. Bear’s mission to stress test every balance sheet on planet Earth and most are going to fail. It will be horrible, but once the global economy is freed from the burdens of debt the “policy makers” have yoked them to, it can once again grow and prosper.
I don’t think any of us are going get through the coming troubled times unscathed. Expect a repeat of the Depressing 1930s. But all things come to an end, even universal-economic misery. And when it does you’ll want to have assets that will remain viable as well as valuable, which most likely won’t be shares of Apple or Amazon or US T-bonds. Gold and silver, having no counterparty risks have traditionally proven to safe-haven assets in financial times of trouble. The same could be said for mining companies which produce them.
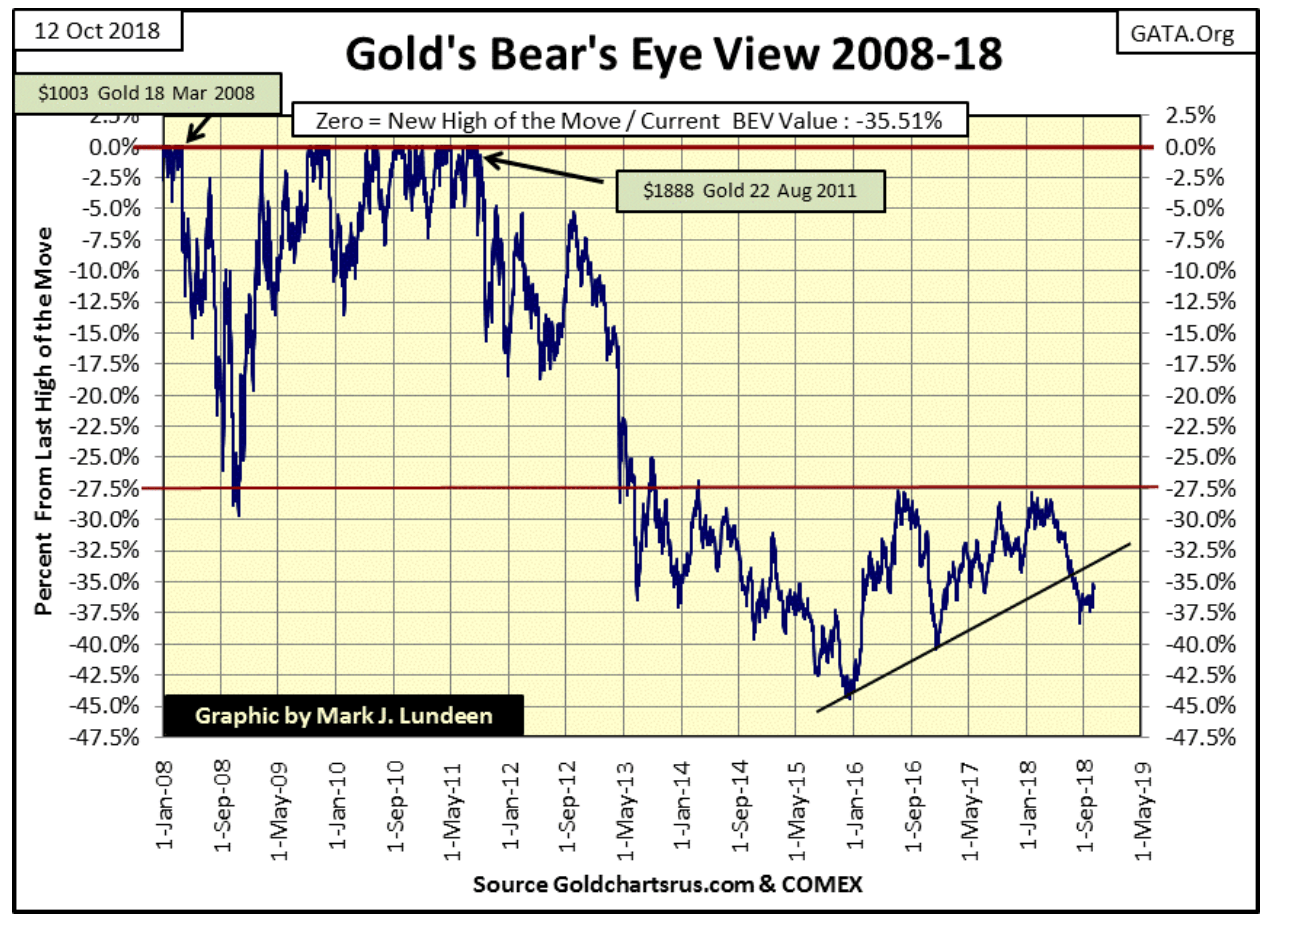
Here’s gold’s BEV chart. Gold had a good week, but not good enough to make an impact in the chart below. My above comments on the stock market are very bearish. However, until we see gold and silver take off, advancing towards their old all-time highs with some enthusiasm, I don’t recommend anyone get too pessimistic on the stock market just yet. But it does seem a good idea to reduce one’s exposure to Wall Street and increase their positions in gold, silver and their mining shares.
© Mark Lundeen
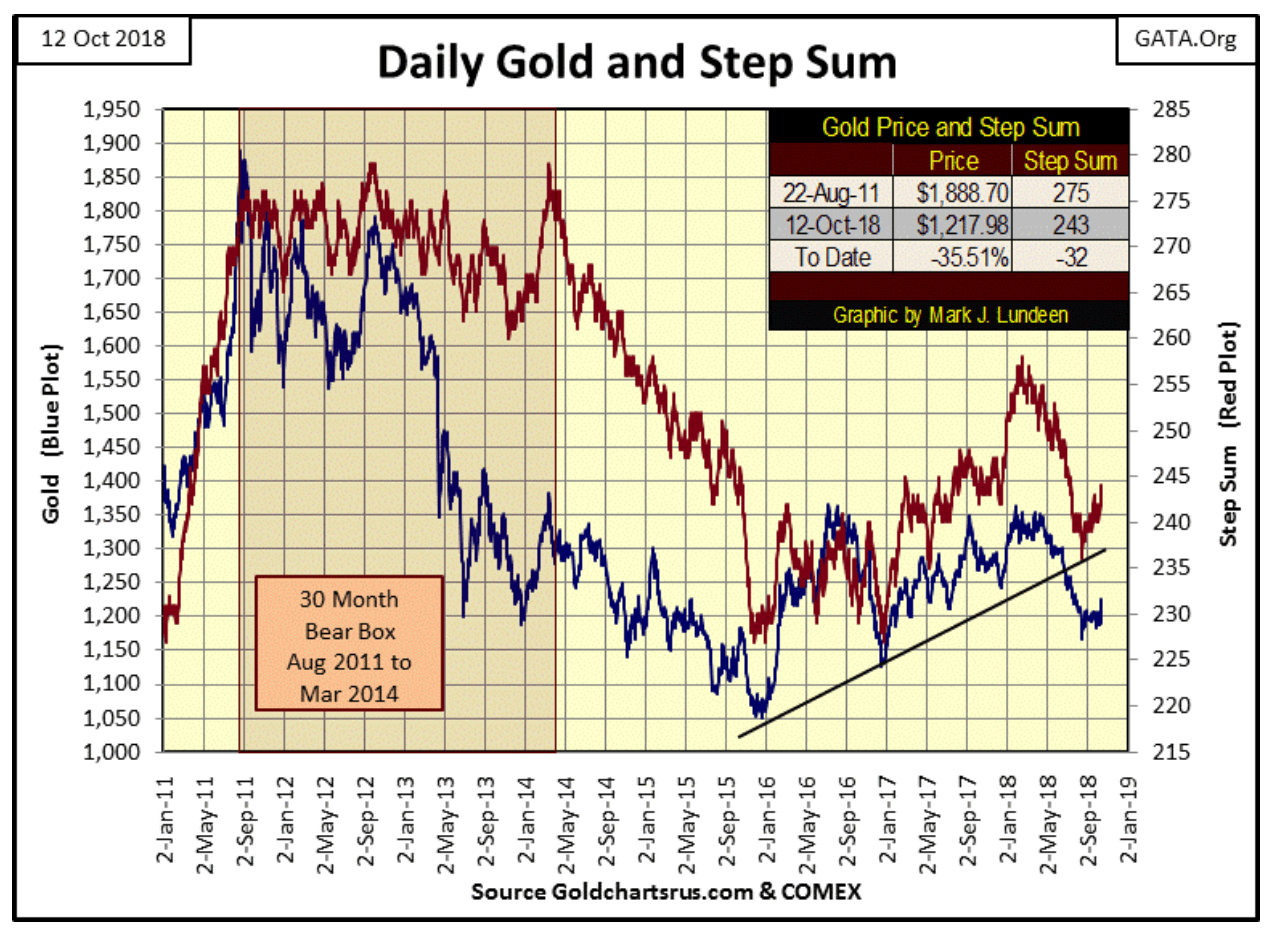
In gold’s step sum chart below, since the end of August, its step sum has been advancing with little effect on the price of gold. Usually, that’s not good, that a market series is enjoying more advancing days than decliners, yet the valuation of the asset somehow doesn’t rise; what’s with that?
Well, it’s usually darn bearish. But for gold in October 2018, apparently, the price of gold after six weeks is taking the hint from its step sum and is moving up. What would be a real positive for the gold market (silver too) would be for gold to see an extreme day of volatility (a >3 percent advance from the previous day’s close) on a bad day for the stock market.
© Mark Lundeen
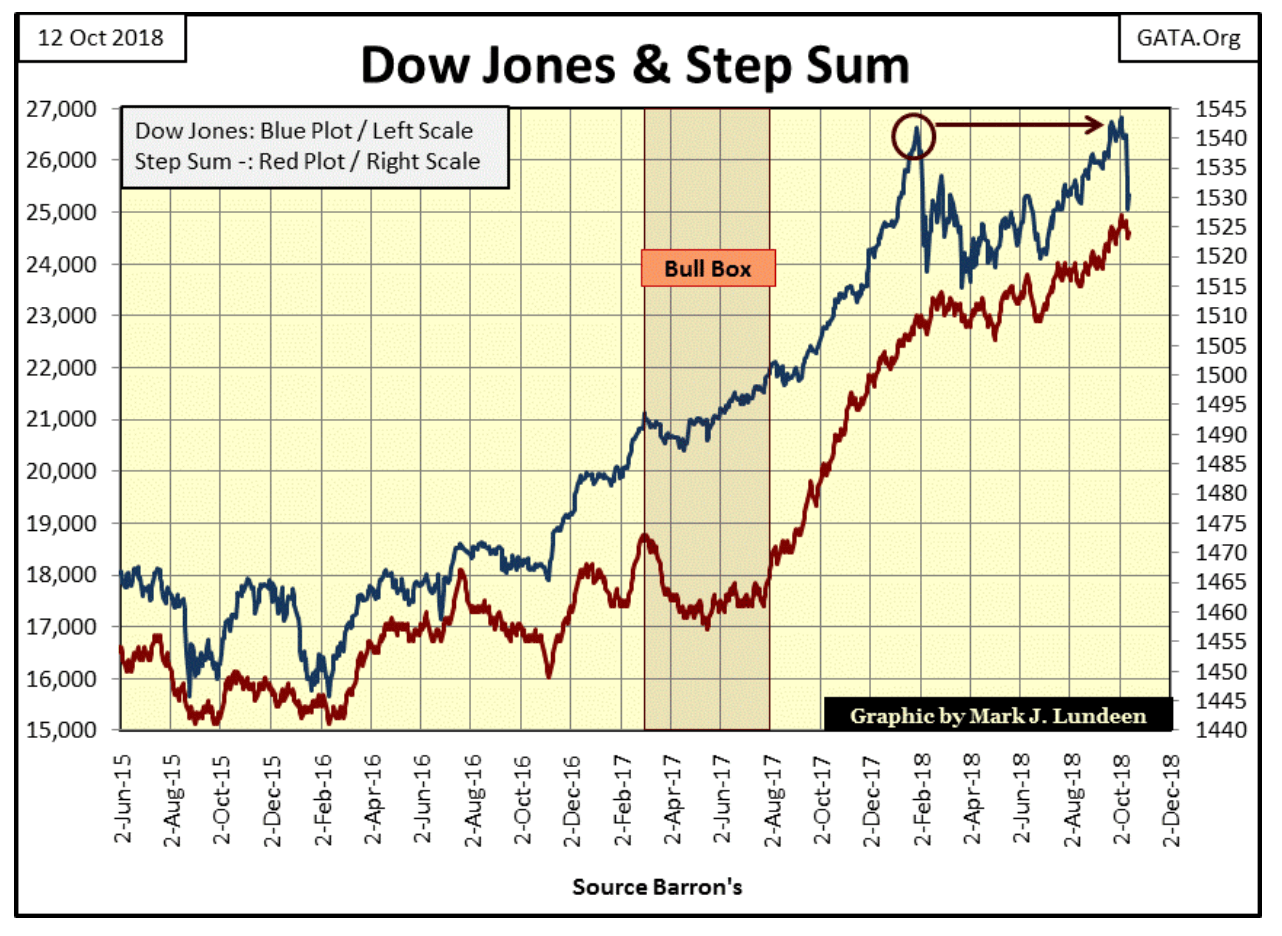
Moving on to the Dow Jones’ step sum chart, what a difference from last week; which causes me to wonder what this chart will look like next week. But whether the Dow Jones makes a recovery, or declines even further, seeing something like this to happen to the Dow Jones so soon after making four new all-time highs in the past few weeks is damning. Obviously, the stock market now finds it easier to go down than up. Until the bulls can prove me wrong with some more new all-time highs in the week to come, that’s how I’ll continue seeing the stock market.
© Mark Lundeen
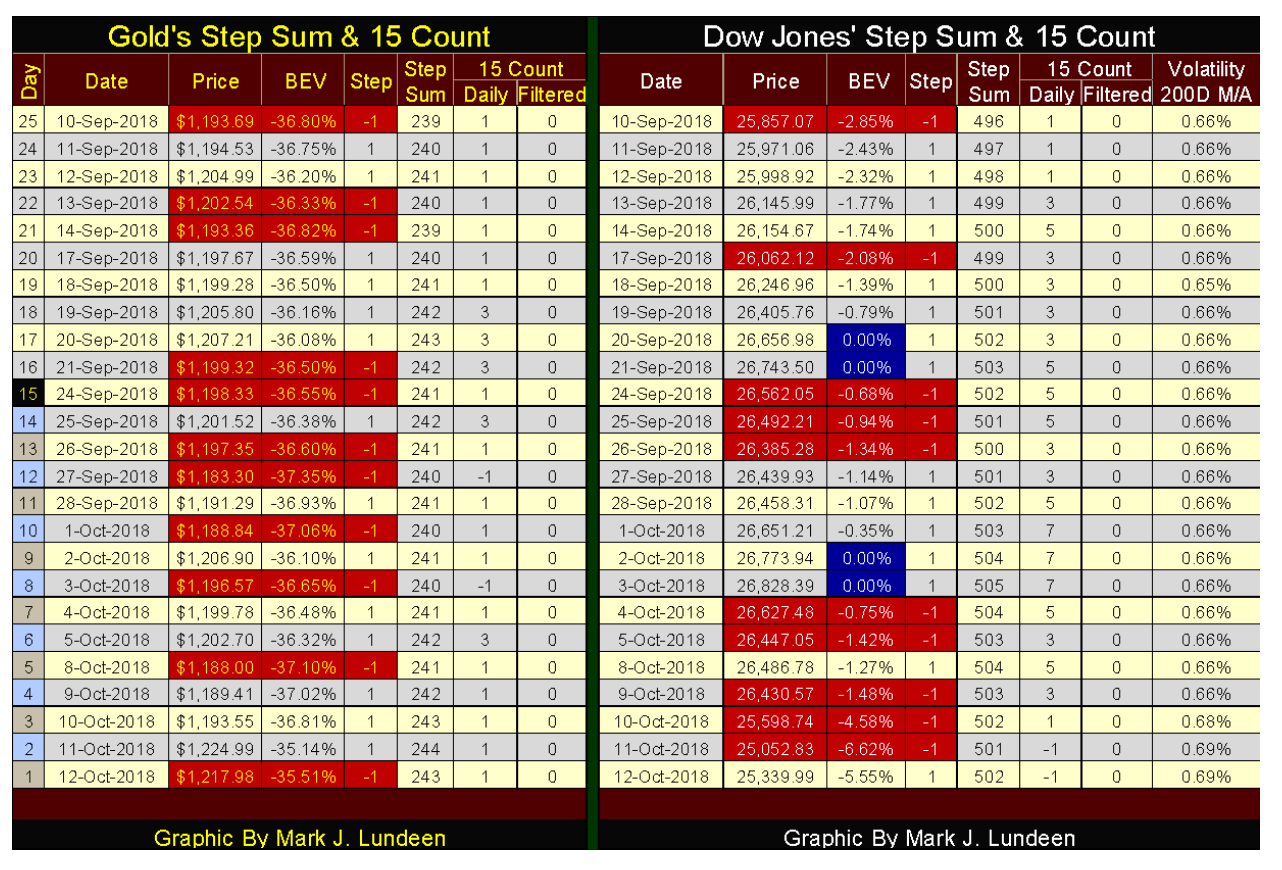
Looking at gold’s step sum table below, its up about 2 percent since September 10th as its step sum increased from 239 to 243. It would have been nice to have seen a bit more of an advance from those four net advancing days. But looking at gold’s daily 15 count, we see lots of 1s and 3s, so there hasn’t been a lot of buying pressure in the gold market either. Hopefully, that will change in the month to come.
© Mark Lundeen
The Dow Jones is a different story altogether. From September 10th to October 3rd, the Dow Jones advanced by 3.76 percent as its step sum increased by nine net advancing days. That’s good bull market action, and then its 15 count from September 21st to October 3rd was mostly 5s and 7s. That may not be a market mania, but the market was a ready buyer of what Wall Street was selling. Then came October 10th, and the Dow Jones hit a brick wall.
What will next week bring? Like me, you’re going to have to wait to see.
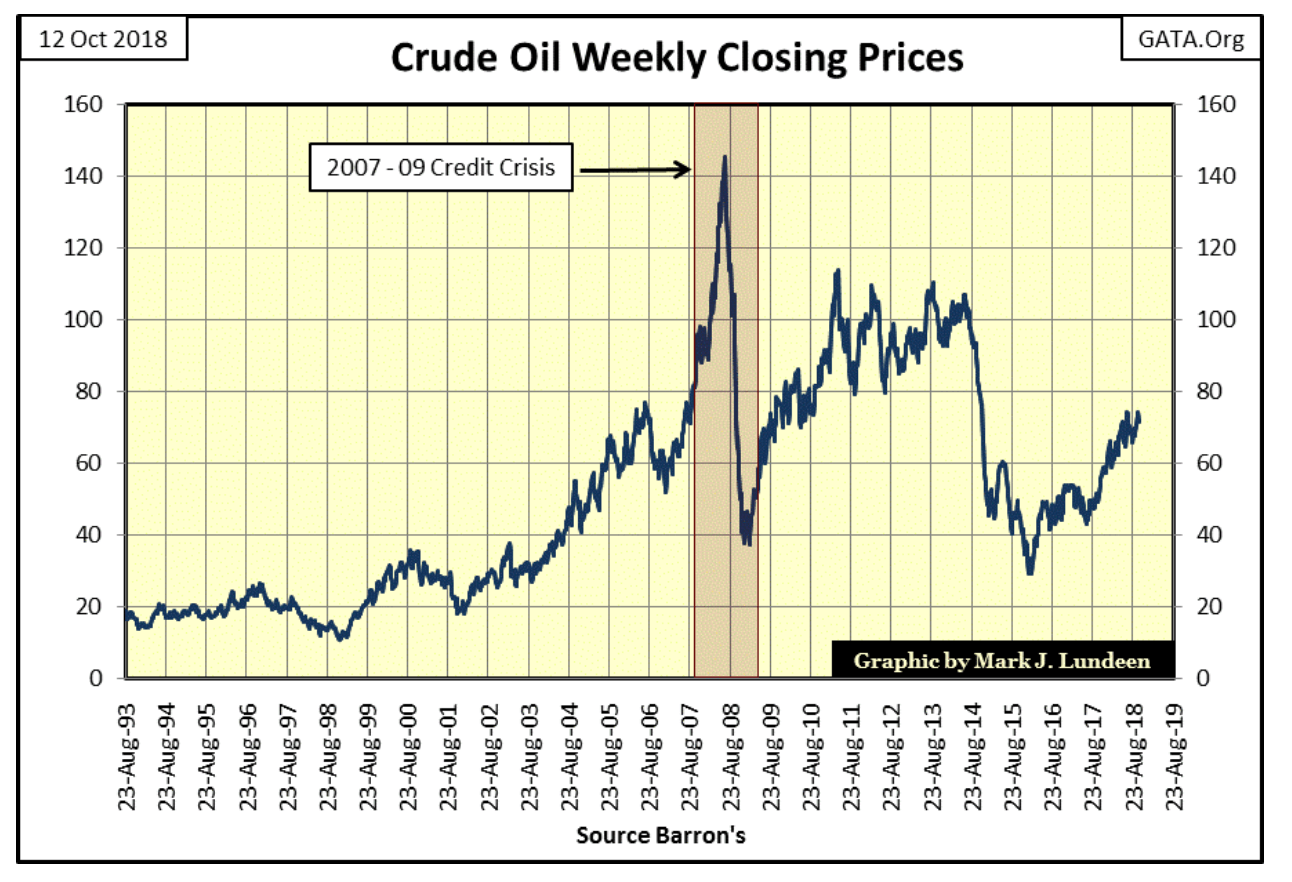
Here’s a chart for crude oil prices going back to 1993. During the credit crisis, flight capital fled the financial markets into crude oil. But it didn’t last as the “great recession” resulted in a drop in the demand for crude that resulted in a price collapse. The same thing happened in the gold and silver markets, dollars fleeing Wall Street headed into gold, silver and their miners, but they didn’t see a collapse in price until 2011.
© Mark Lundeen
No market operates in a vacuum. Should the financial markets (stocks and bonds) enter into a big bear market, dollars now circulating in them are going to get up and go somewhere else if they want to survive. If the deflation seen in the Dow Jones this week become chronic, expect to see the valuations in gold, silver and their miners begin to inflate as a reaction.
(Featured image by DepositPhotos)
—
DISCLAIMER: This article expresses my own ideas and opinions. Any information I have shared are from sources that I believe to be reliable and accurate. I did not receive any financial compensation for writing this post, nor do I own any shares in any company I’ve mentioned. I encourage any reader to do their own diligent research first before making any investment decisions.


Youth Cannabis Use in Colorado Is Falling — But the Full Story Is More Complex
The 2026 Colorado survey shows teen cannabis use fell to 10 percent in 2025, down from 21 percent in 2015....


Morocco’s Growth Holds at 4.6% as Agriculture Offsets Economic Pressures
Morocco’s economy grew 4.6% in Q1 2026, driven by a strong agricultural rebound offsetting declines in industry. Services expanded moderately...


Abivax Shares Surge as New Trial Data Eases Safety Concerns Over Ulcerative Colitis Drug
Abivax shares surged nearly 36% after positive updated trial results for its ulcerative colitis drug obefazimod reassured investors following earlier...


El Dorado Raises $9M to Expand Cross-Border Fintech Platform
El Dorado, a Latin American fintech improving cross-border financial services, raised a $9 million Series A led by Paradigm with...


Bitcoin Stalls Near $60K as Strategy Moves, ETFs Outflow, and EU MiCA Rules Take Effect
Bitcoin hovers near $60,000 with ETF outflows, while Strategy boosts reserves, sells BTC, and raises dividends to reassure investors. Ethereum...
 |
|
 |  |
 |
|
-

 Africa1 week ago
Moroccan Bond Market Shows Mixed Signals as Primary Eases and Secondary Pressures Persist
-

 Fintech6 days ago
Talentir Secures €4M to Transform Global Payouts
-

 Cannabis2 weeks ago
WNBA Removes Cannabis From Banned Substances List in New CBA
-

 Markets1 day ago
Cotton Market Weakness Persists Despite Brief Rebound
You must be logged in to post a comment Login